This is part of the Iowa Graduation Rate series, examining trends in the Class of 2019-2024.
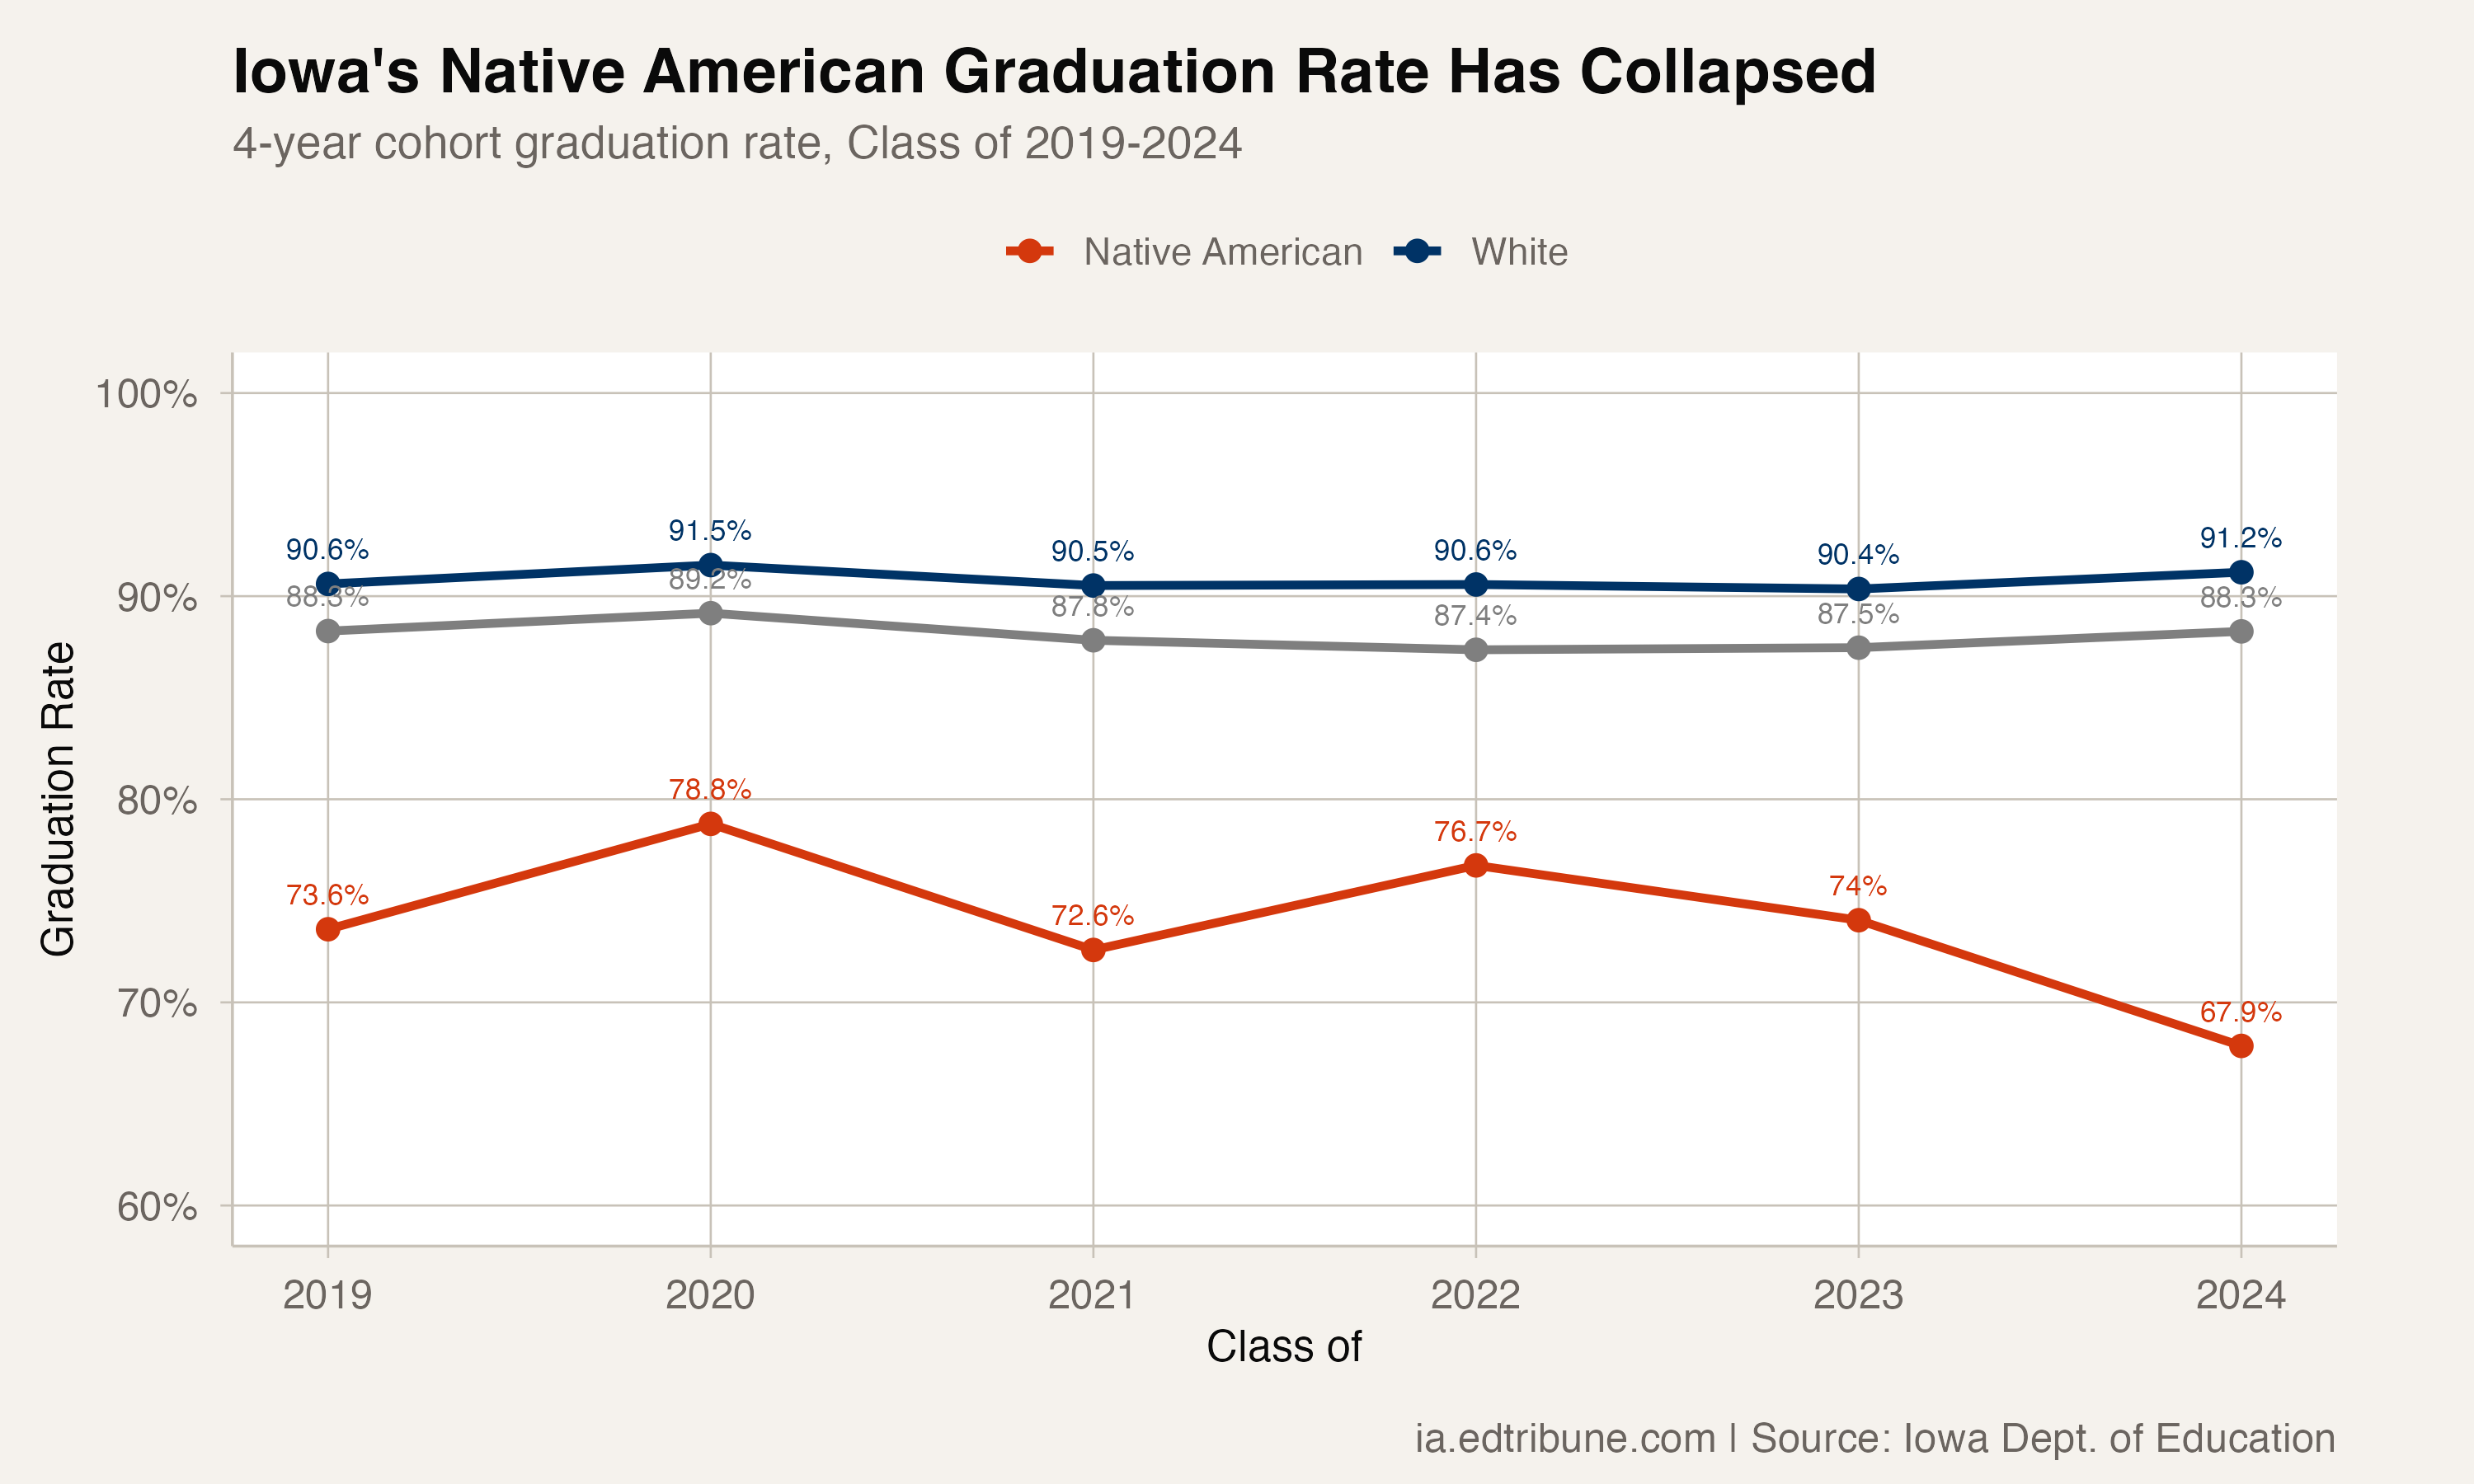
Iowa's Native American students graduated at 68% in 2024, a rate that would qualify as a crisis in any year. What makes this figure more alarming is the trajectory: the rate was 79% just four years ago.
The 11-point collapse from 2020 to 2024 is the steepest decline of any racial group in the state. While Iowa's overall graduation rate returned to its pre-pandemic level of 88%, and while Black and Hispanic students climbed back from their 2022 lows, Native American students moved sharply in the opposite direction.
The white-Native American graduation gap now stands at 23 points — wider than it has been in any year of available data and nearly double its 2020 low of 13 points.
Small numbers, real consequences
Iowa's Native American graduating cohort is small — 112 students in the Class of 2024, compared to 28,507 white students. That small denominator means each student who does not graduate shifts the rate by nearly a full percentage point.
But the sustained downward trend across six years of data makes it difficult to dismiss as statistical noise. The rate has declined in three of the last five years, including each of the last two:
| Class of | Graduation Rate | Cohort Size |
|---|---|---|
| 2019 | 73.6% | 125 |
| 2020 | 78.8% | 132 |
| 2021 | 72.6% | 124 |
| 2022 | 76.7% | 129 |
| 2023 | 74.0% | 131 |
| 2024 | 67.9% | 112 |
The 2024 cohort was also the smallest, with 112 students compared to an average of 128 over the prior five years. Thirty-six students in the cohort did not graduate on time.
A widening gap
In 2020, the white-Native American gap stood at 13 points — still significant, but narrowing. That was the year Native American students hit their highest graduation rate in the dataset at 79%.
Since then, the gap has nearly doubled. It reached 18 points in 2021, dipped to 14 in 2022, and then expanded to 23 points in 2024 as the Native American rate fell while the white rate climbed to 91%.
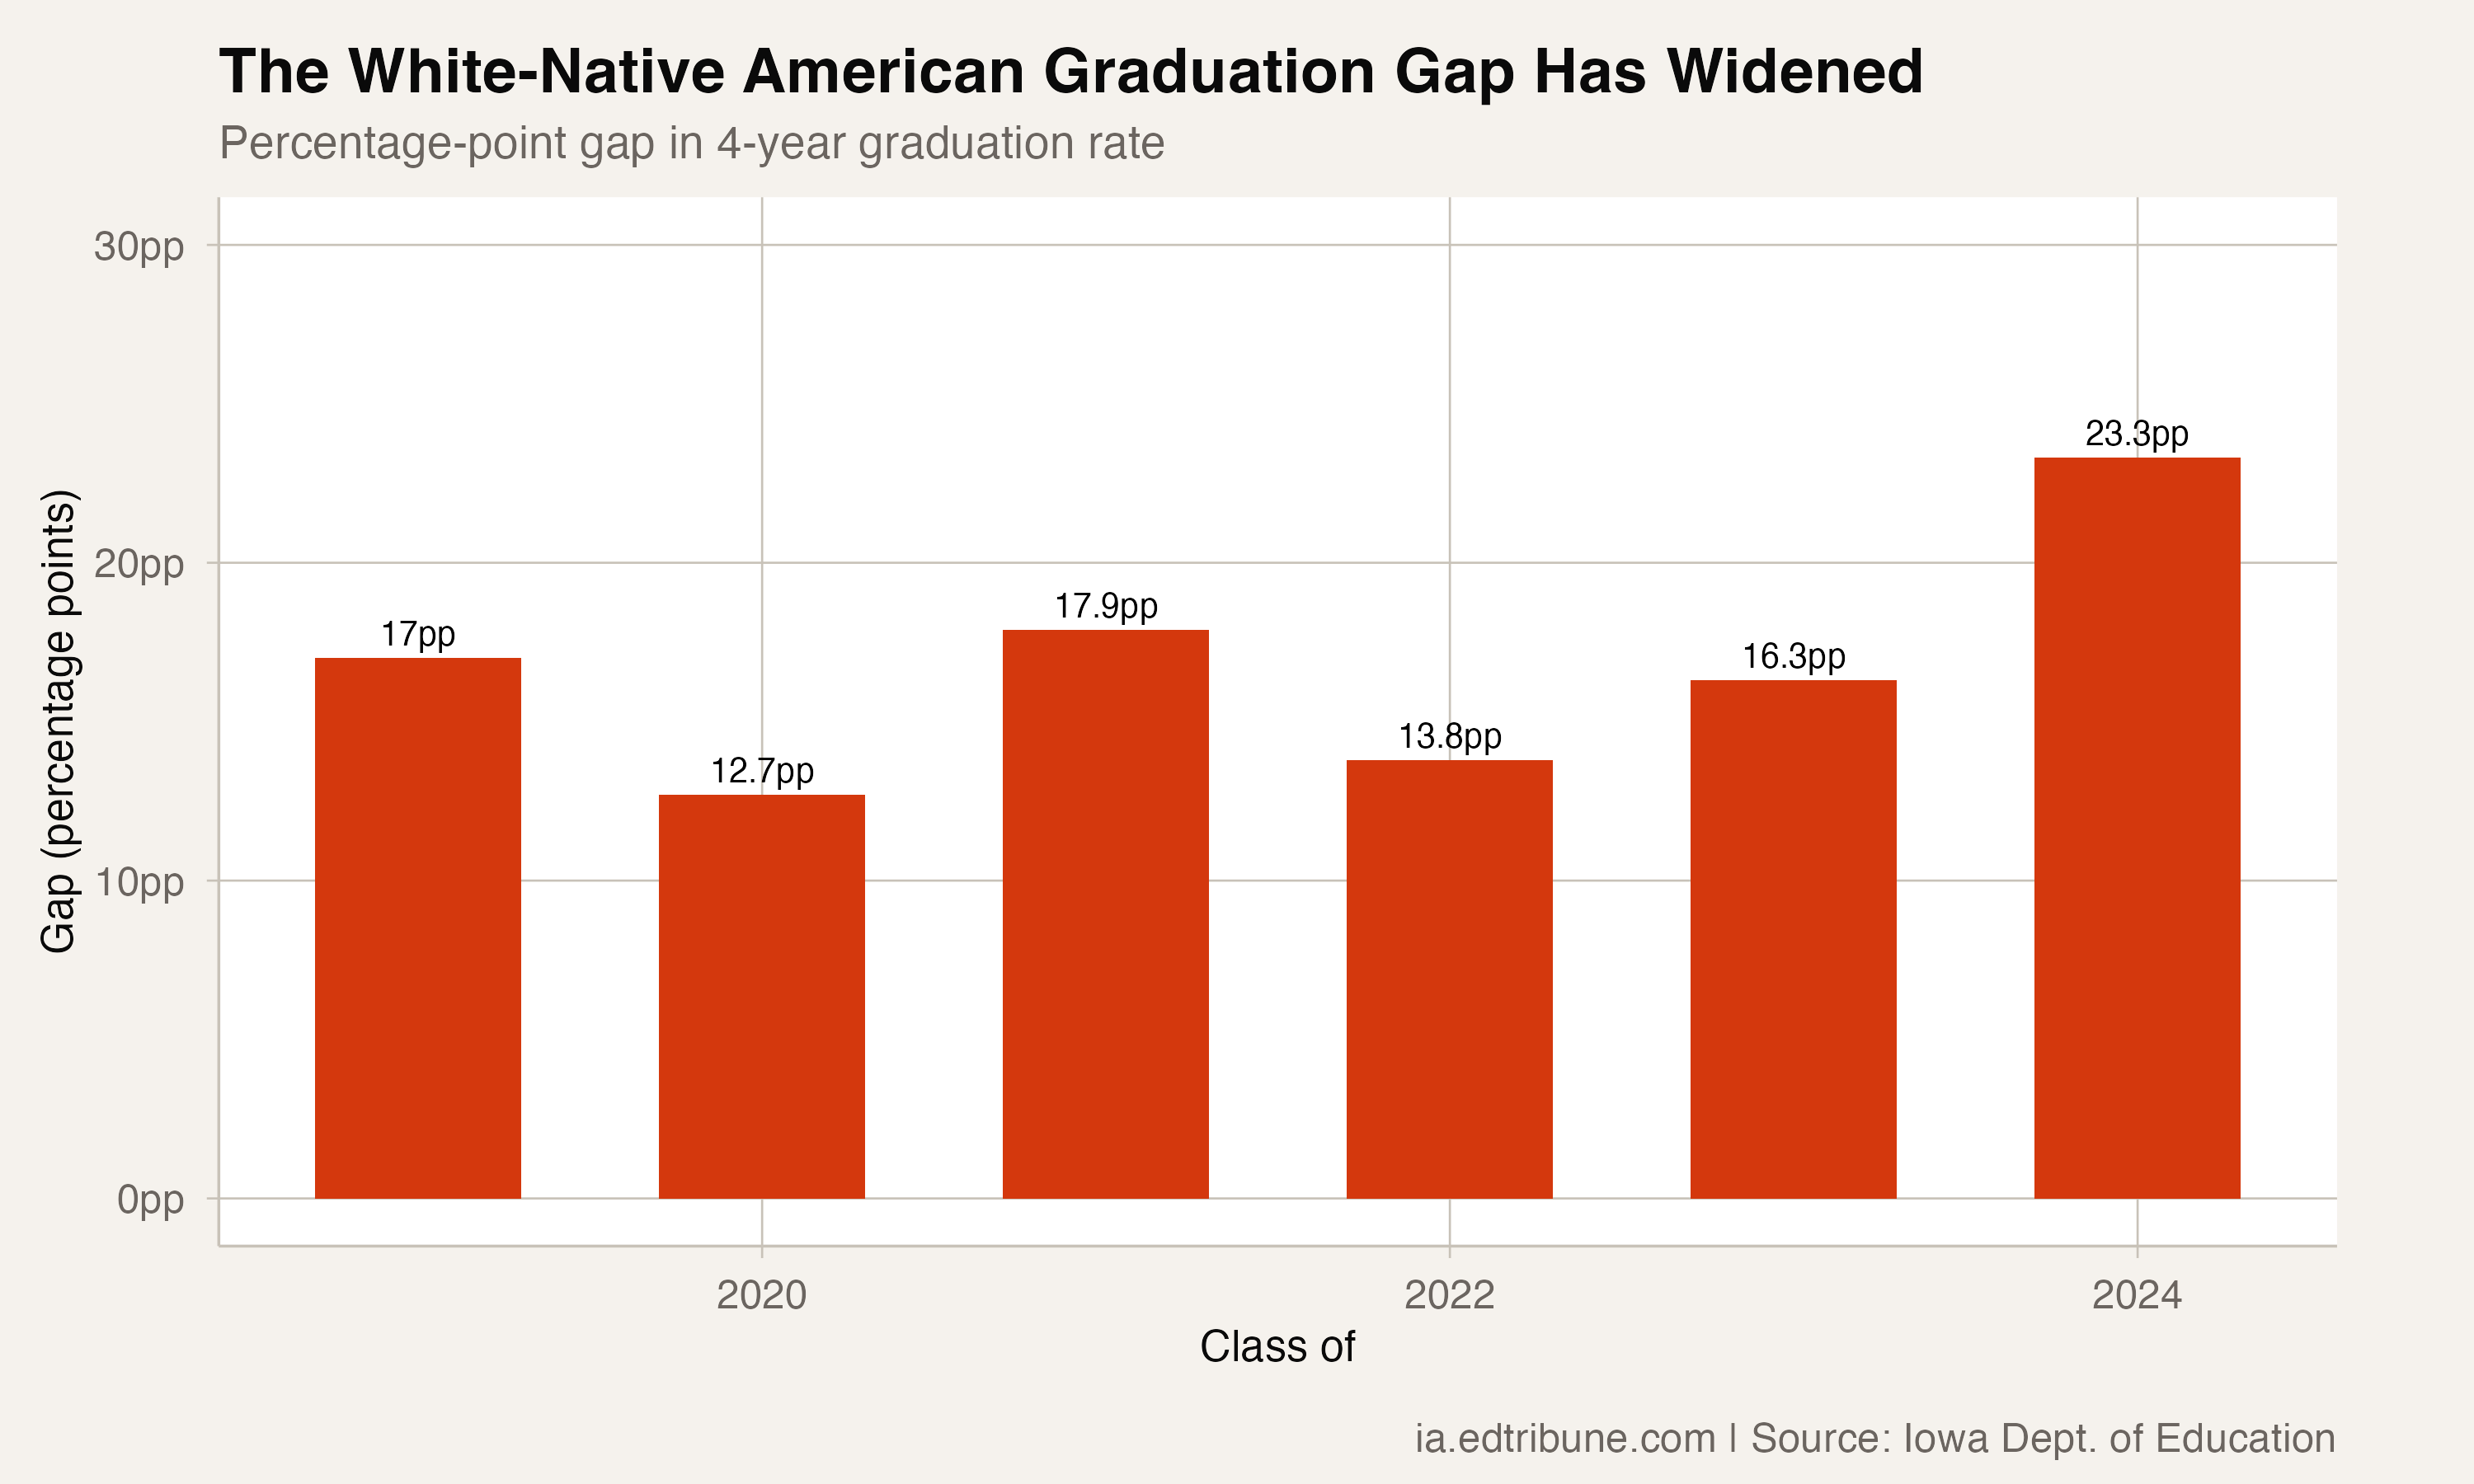
No other racial gap in Iowa approaches this magnitude. The white-Black gap is 15 points. The white-Hispanic gap is 10 points. The white-multiracial gap is 10 points.
Where Iowa's racial gaps stand
The 2024 graduation data reveals a clear hierarchy among racial subgroups in Iowa. White and Asian students graduate above the state average of 88%. Multiracial and Hispanic students sit roughly 7 points below; Black students are about 13 points below. Native American and Pacific Islander students are at the bottom, both below 70%.
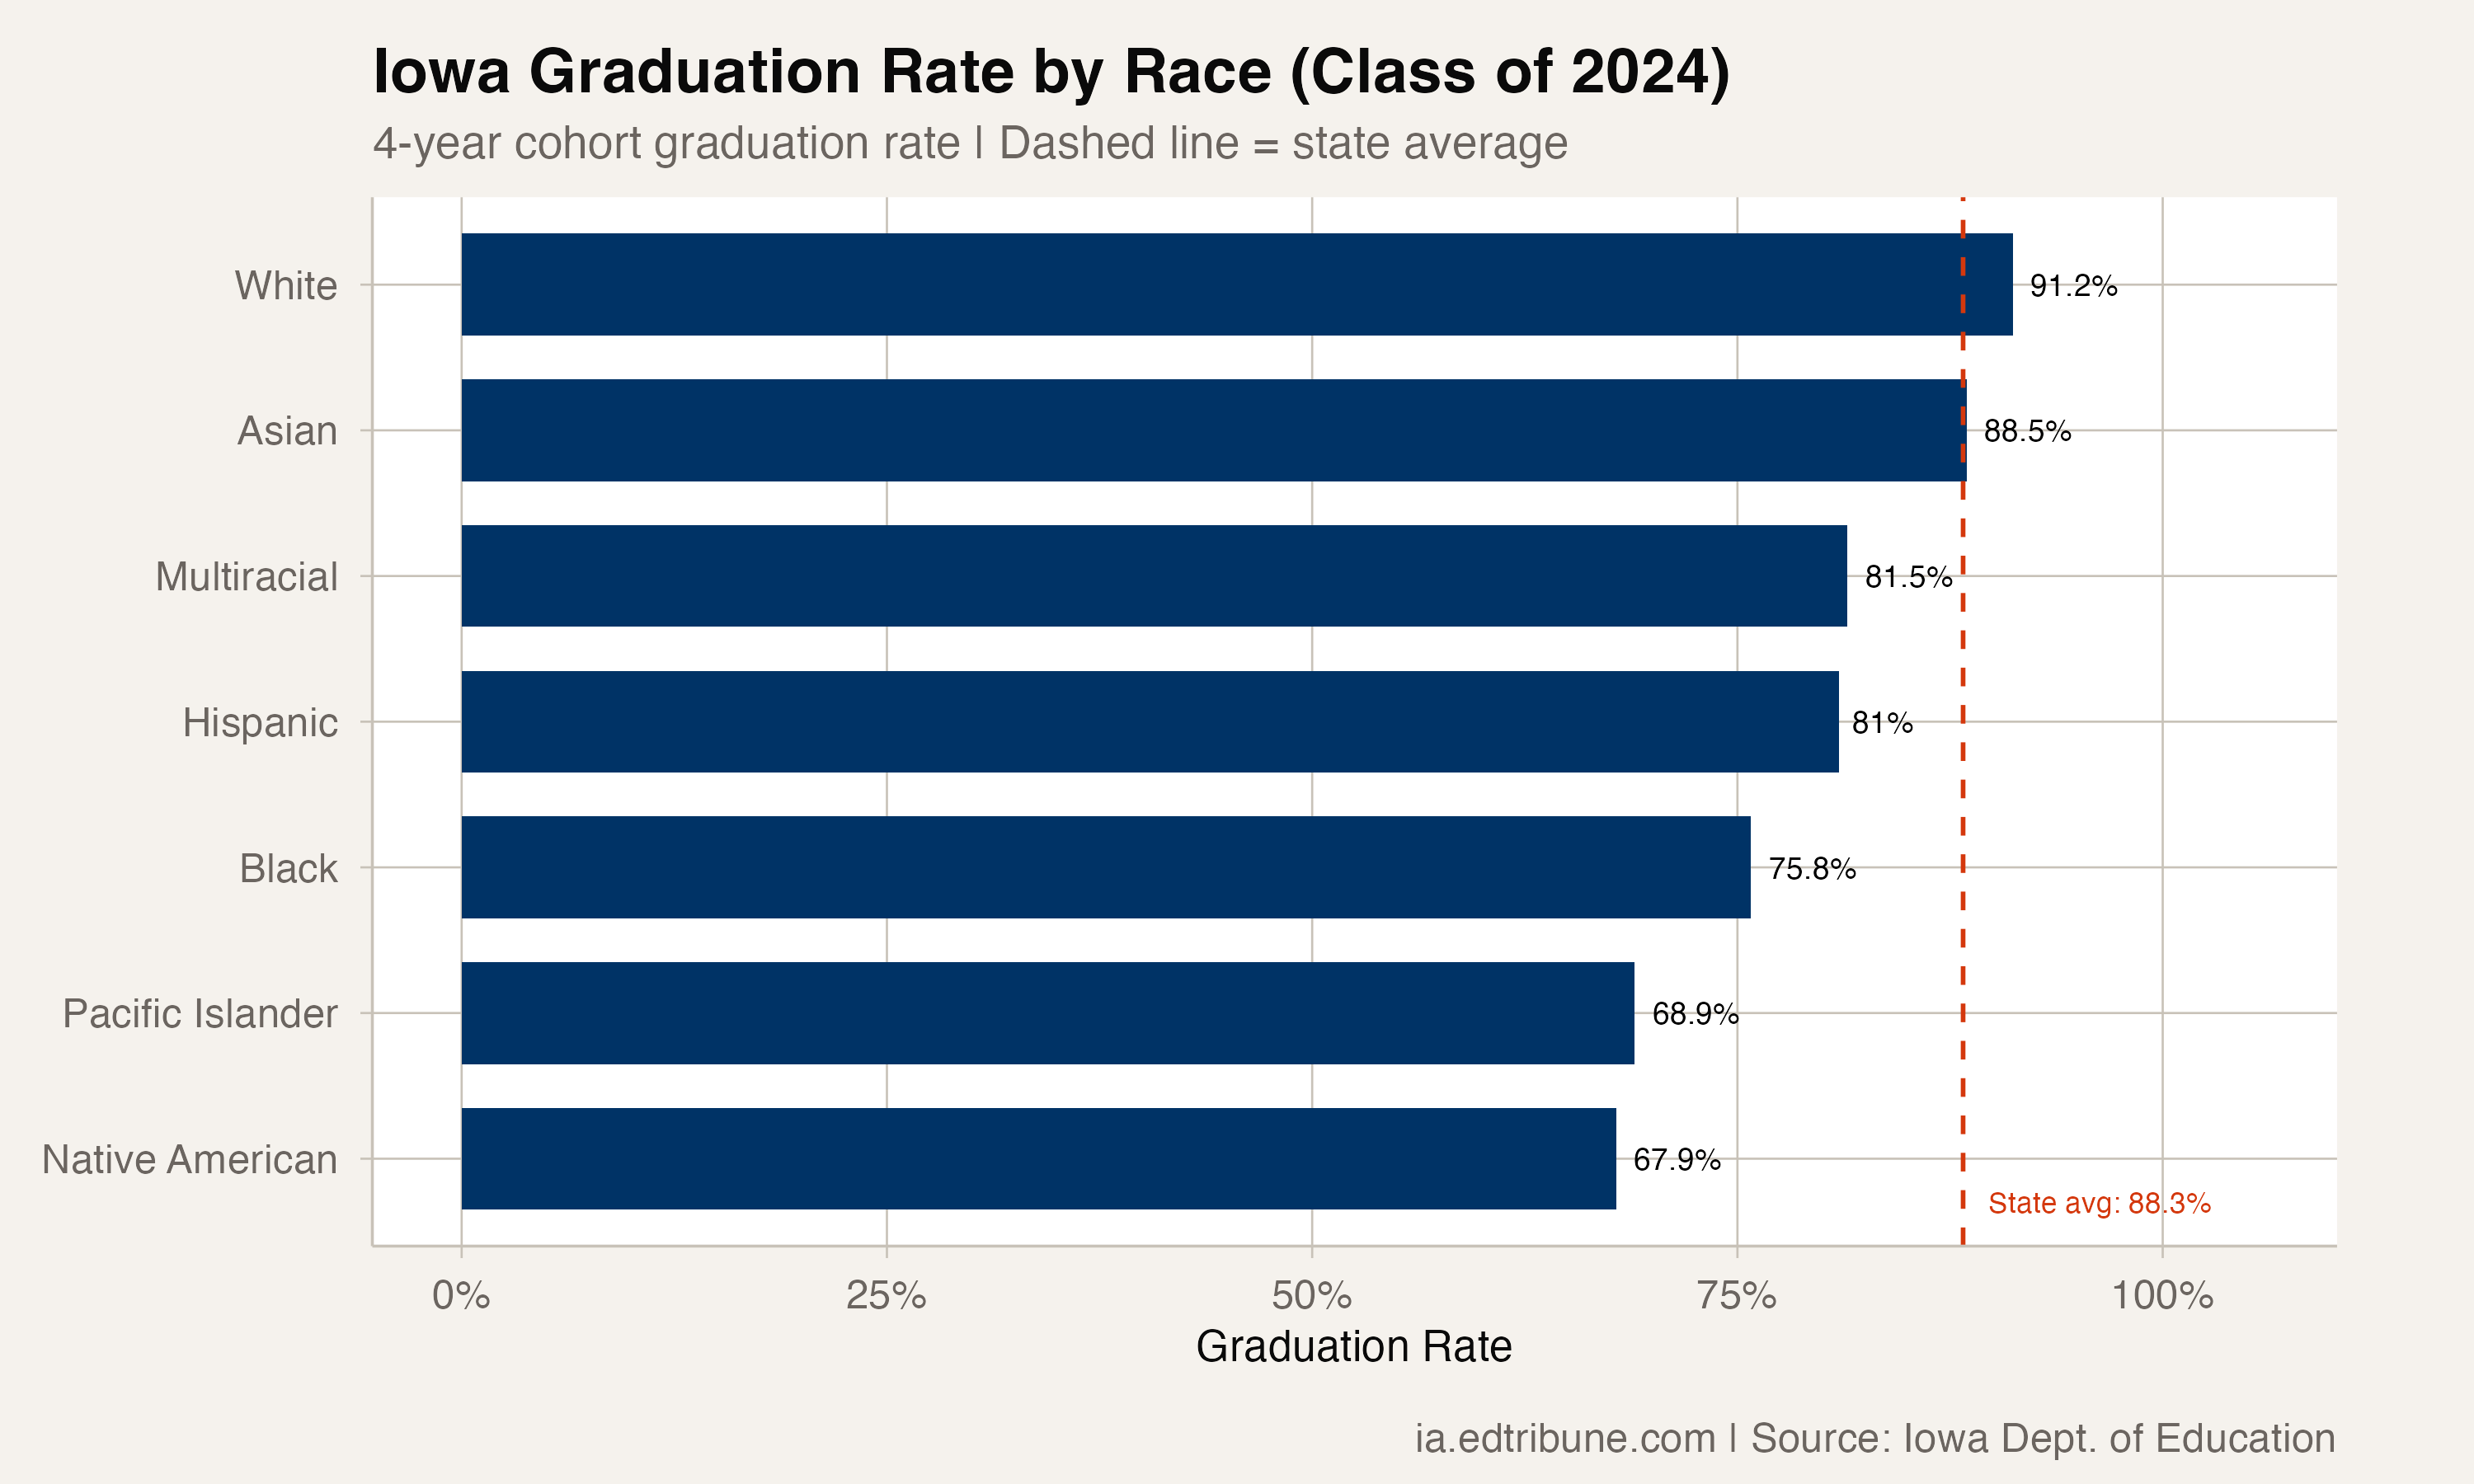
Pacific Islander students, at 69%, actually improved from a low of 60% in 2022. But Native American students moved in the opposite direction during the same period.
Context beyond the numbers
Iowa's Native American population is concentrated in the Meskwaki Settlement near Tama, home to the Sac and Fox Tribe of the Mississippi in Iowa. Students there attend the South Tama County Community School District or the Meskwaki Settlement School, a Bureau of Indian Education school.
The state's graduation data does not distinguish between tribal school and public school students, nor does it provide district-level breakdowns for this subgroup (the cohort is too small in most individual districts to report without privacy suppression). The 68% figure is a statewide aggregate across all settings where Native American students are enrolled.
Nationally, the Native American graduation rate has lagged behind other groups for decades. Iowa's 68% is below the most recent national average for Native American students (approximately 74%, per federal data). The collapse in Iowa's rate since 2020 runs counter to modest national gains.
Detailed code that reproduces the analysis and figures in this article is available exclusively to EdTribune subscribers.
Discussion
Sign in to join the discussion.
Loading comments...