This is part of the Iowa Graduation Rate series, examining trends in the Class of 2019-2024.
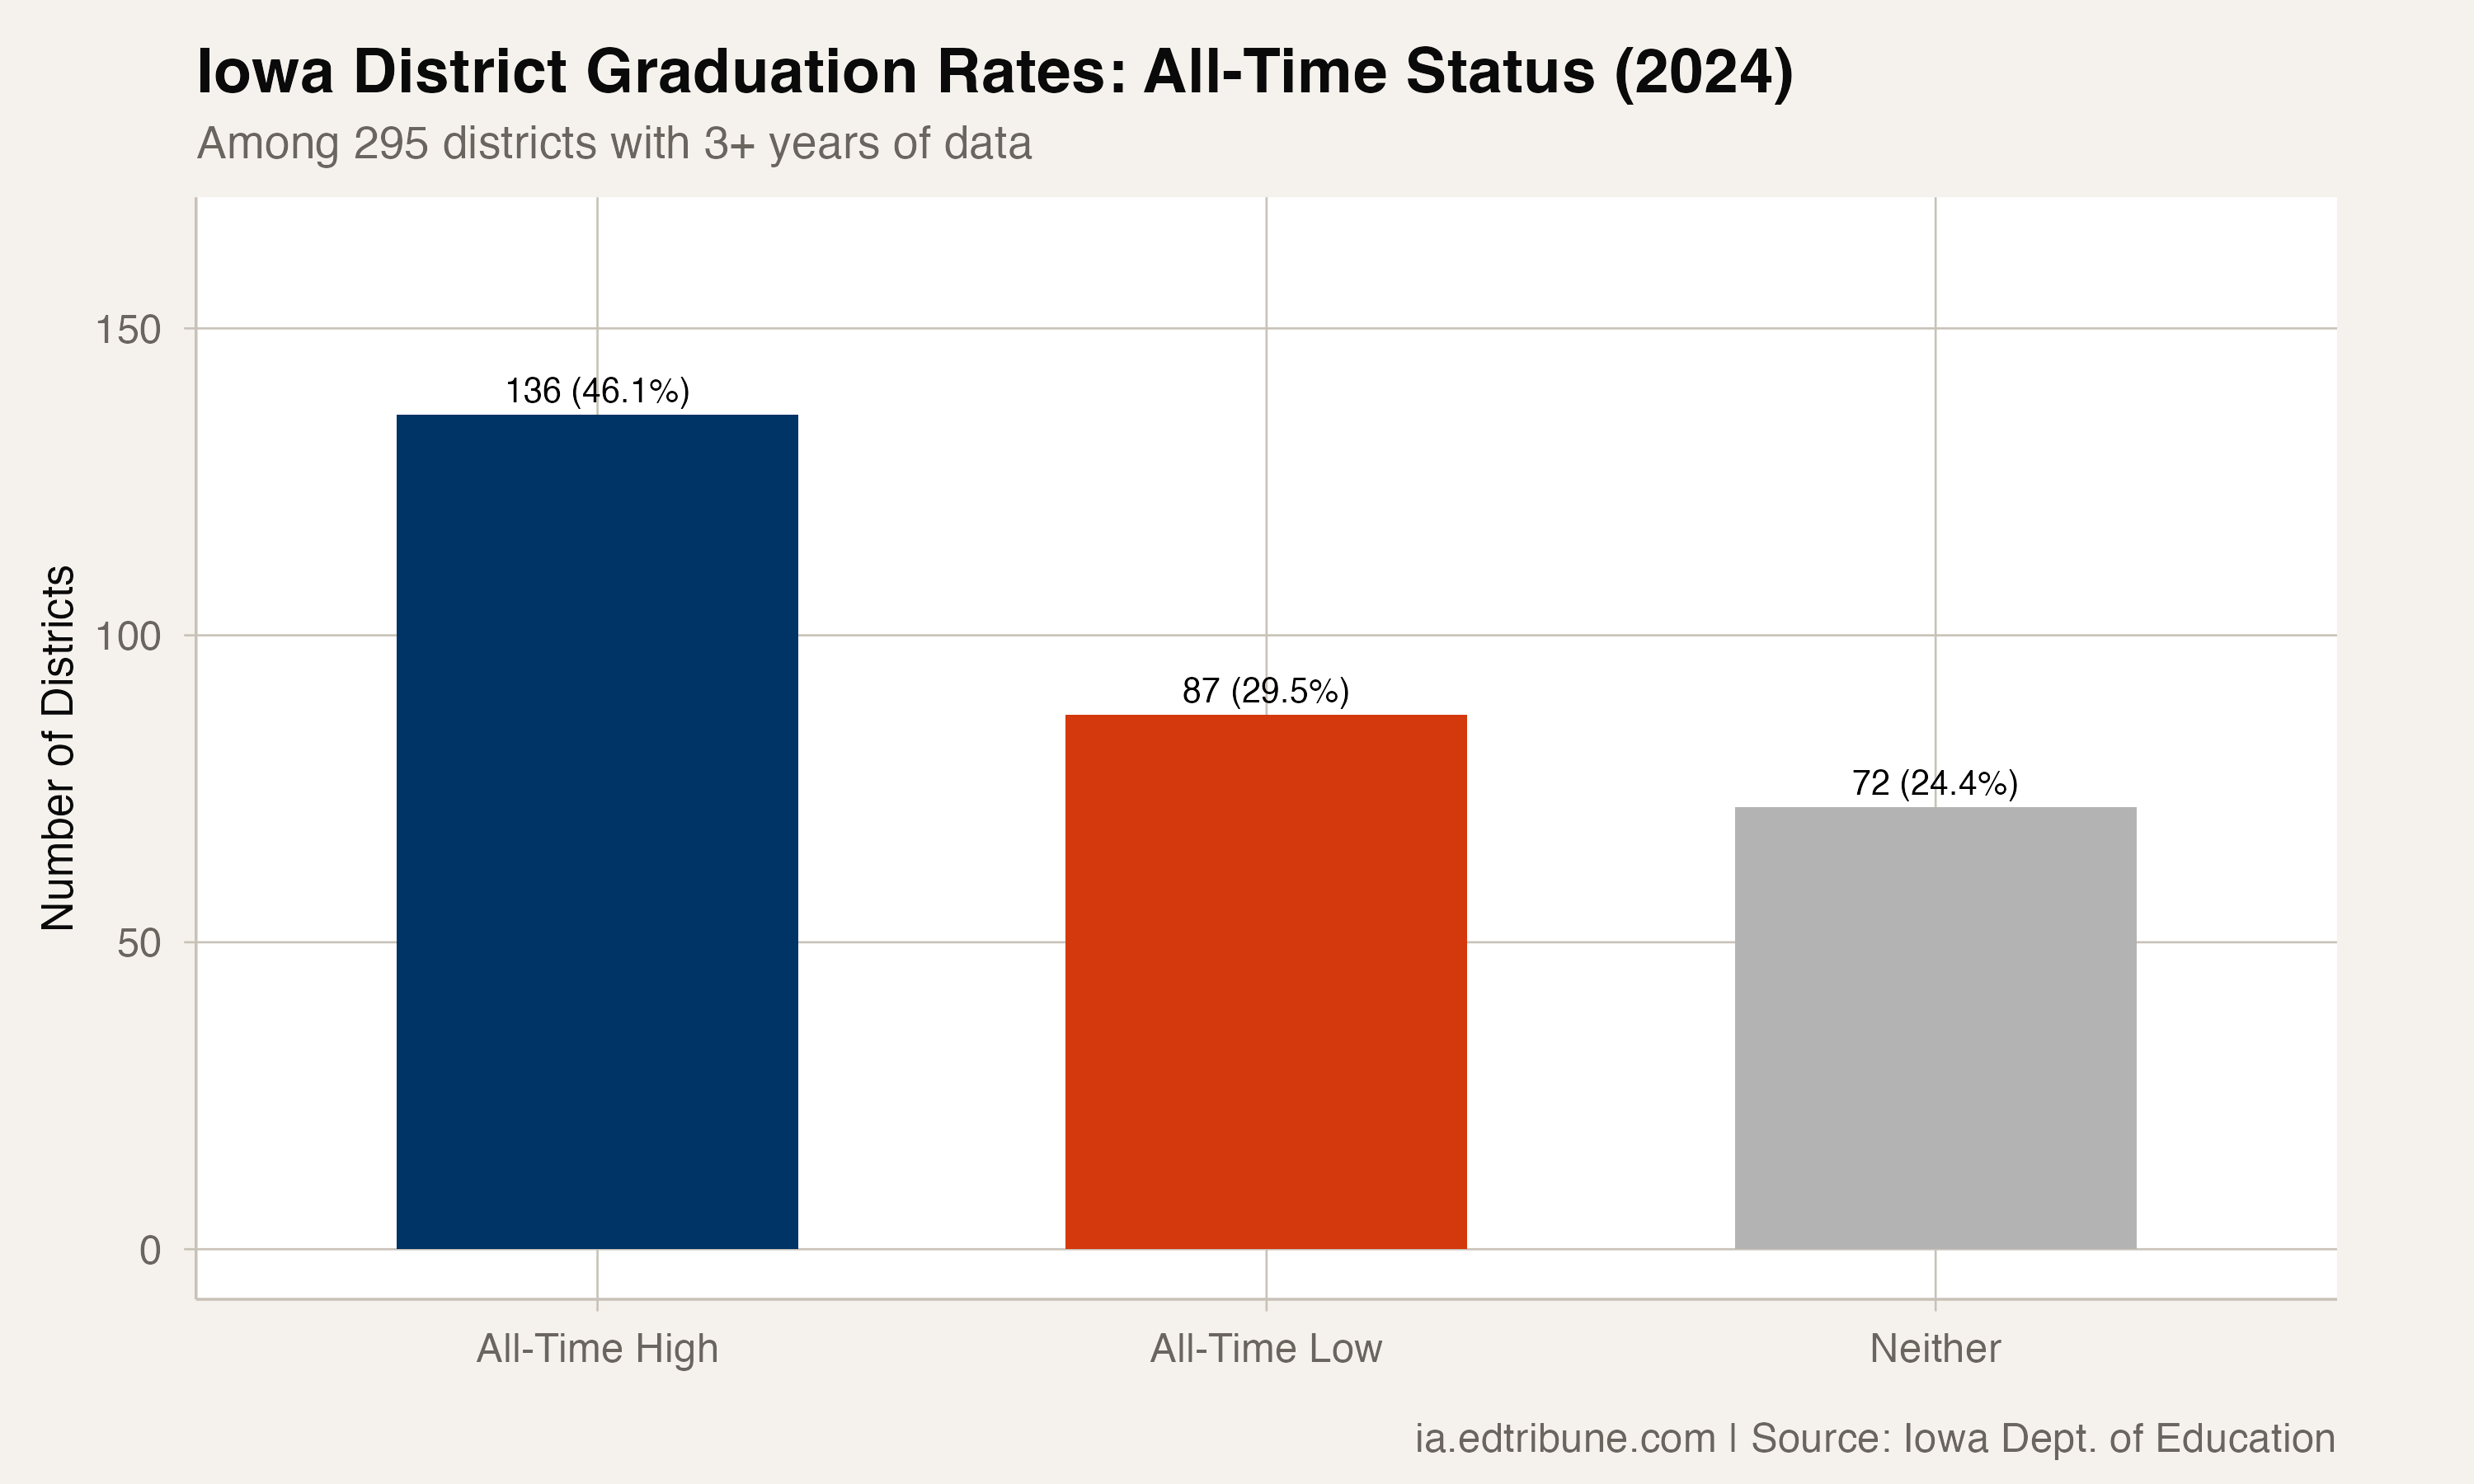
When Iowa's graduation data for the Class of 2024 is sorted district by district, a striking pattern emerges: 136 districts posted their highest graduation rate in the six years of available data. That is 46% of all districts with enough history to measure -- nearly half the state setting records simultaneously.
The good news is real. But it comes with a counterweight. In the same year, 87 districts posted their lowest graduation rate in the dataset. Another 72 fell somewhere in between.
Iowa's graduation story in 2024 is not a state moving together. It is a state splitting apart.
Who is setting records
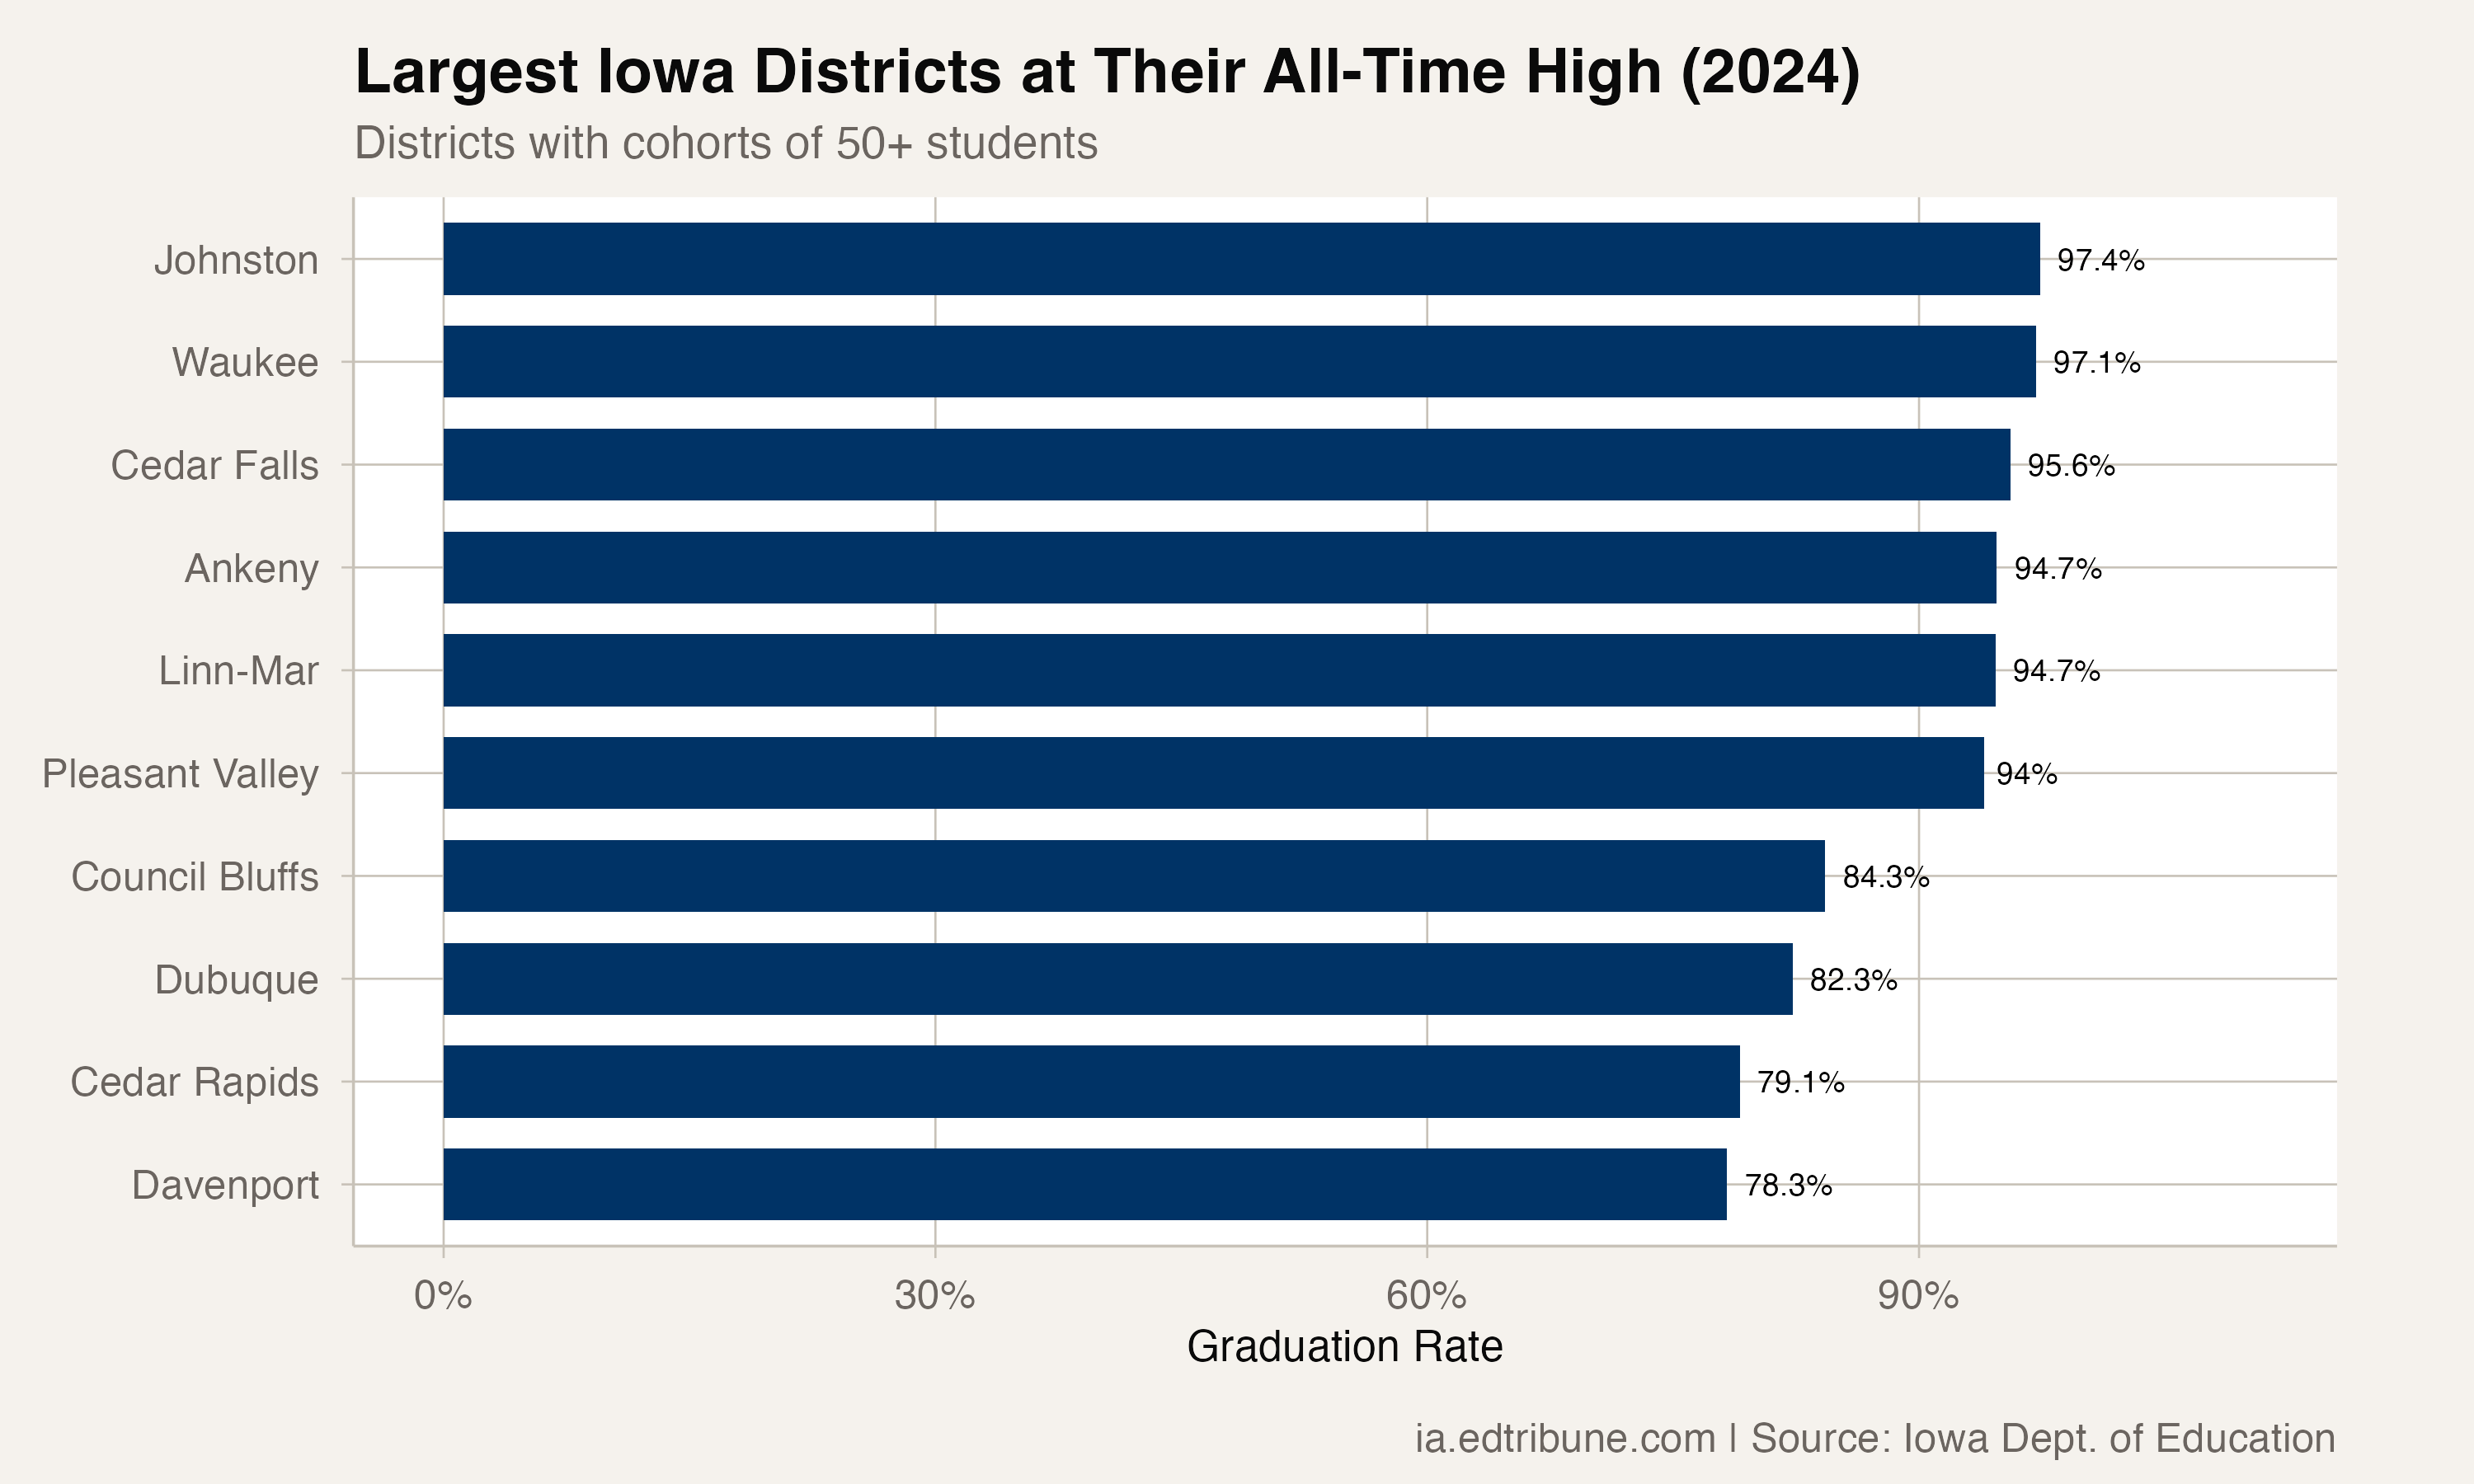
The list of districts at their all-time high includes some of Iowa's largest and most prominent. Waukee↗ET at 97%. Johnston↗ET at 97%. Ankeny↗ET at 95%. Cedar Falls↗ET at 96%. Linn-Mar↗ET at 95%. These suburban districts have steadily improved throughout the data period and reached their peaks in 2024.
More surprising is the presence of some urban districts on the list. Cedar Rapids↗ET hit its all-time high at 79%. Davenport↗ET reached its peak at 78%. Dubuque↗ET at 82%. These rates are still well below the state average, but they represent genuine improvement for districts that have struggled.
Council Bluffs↗ET at 84%, Muscatine↗ET at 85%, and Clinton↗ET at 80% are also at all-time highs -- mid-size communities that have quietly reached levels they have not achieved in the data period.
Nineteen districts graduated 100% of their students. All are small -- cohorts of 25 or fewer -- where a single student's outcome determines whether the rate is 100% or 96%.
Who is at their worst
The all-time low list is led by Des Moines↗ET at 71% -- the state's largest district, at its lowest point in six years. Marshalltown↗ET at 73%. Oelwein↗ET at 67%. Clayton Ridge at 63%.
Sioux City↗ET at 86% is at its all-time low despite a rate that would seem respectable by urban standards. Ames↗ET at 86% -- home to Iowa State University -- also set a low, a result that may surprise residents of a community that prides itself on educational outcomes.
The all-time low list captures districts on downward trajectories, not just districts with bad rates. Several suburban and college-town districts joined the list in 2024 despite graduating well above the state average. Their rates are high but declining, a pattern that bears watching.
Small districts amplify both extremes
Among the 136 districts at their all-time high, 44 have cohorts smaller than 50 students. In these districts, one or two additional graduates can push the rate from 92% to 100%. The same volatility works in reverse: among the 87 at all-time lows, many are small districts where a few non-completers produced an unusually low rate.
The more reliable signal comes from mid-size and large districts. Among districts with cohorts of 100 or more, 46 hit all-time highs and 15 hit all-time lows. The split is less dramatic but still tilted toward improvement.
The distribution
The histogram of Iowa's 2024 graduation rates shows the state's bifurcation visually. The bulk of districts cluster between 85% and 100%, with a long tail stretching down to 30%. The median district graduates above 90%. But the variation below 80% has grown.
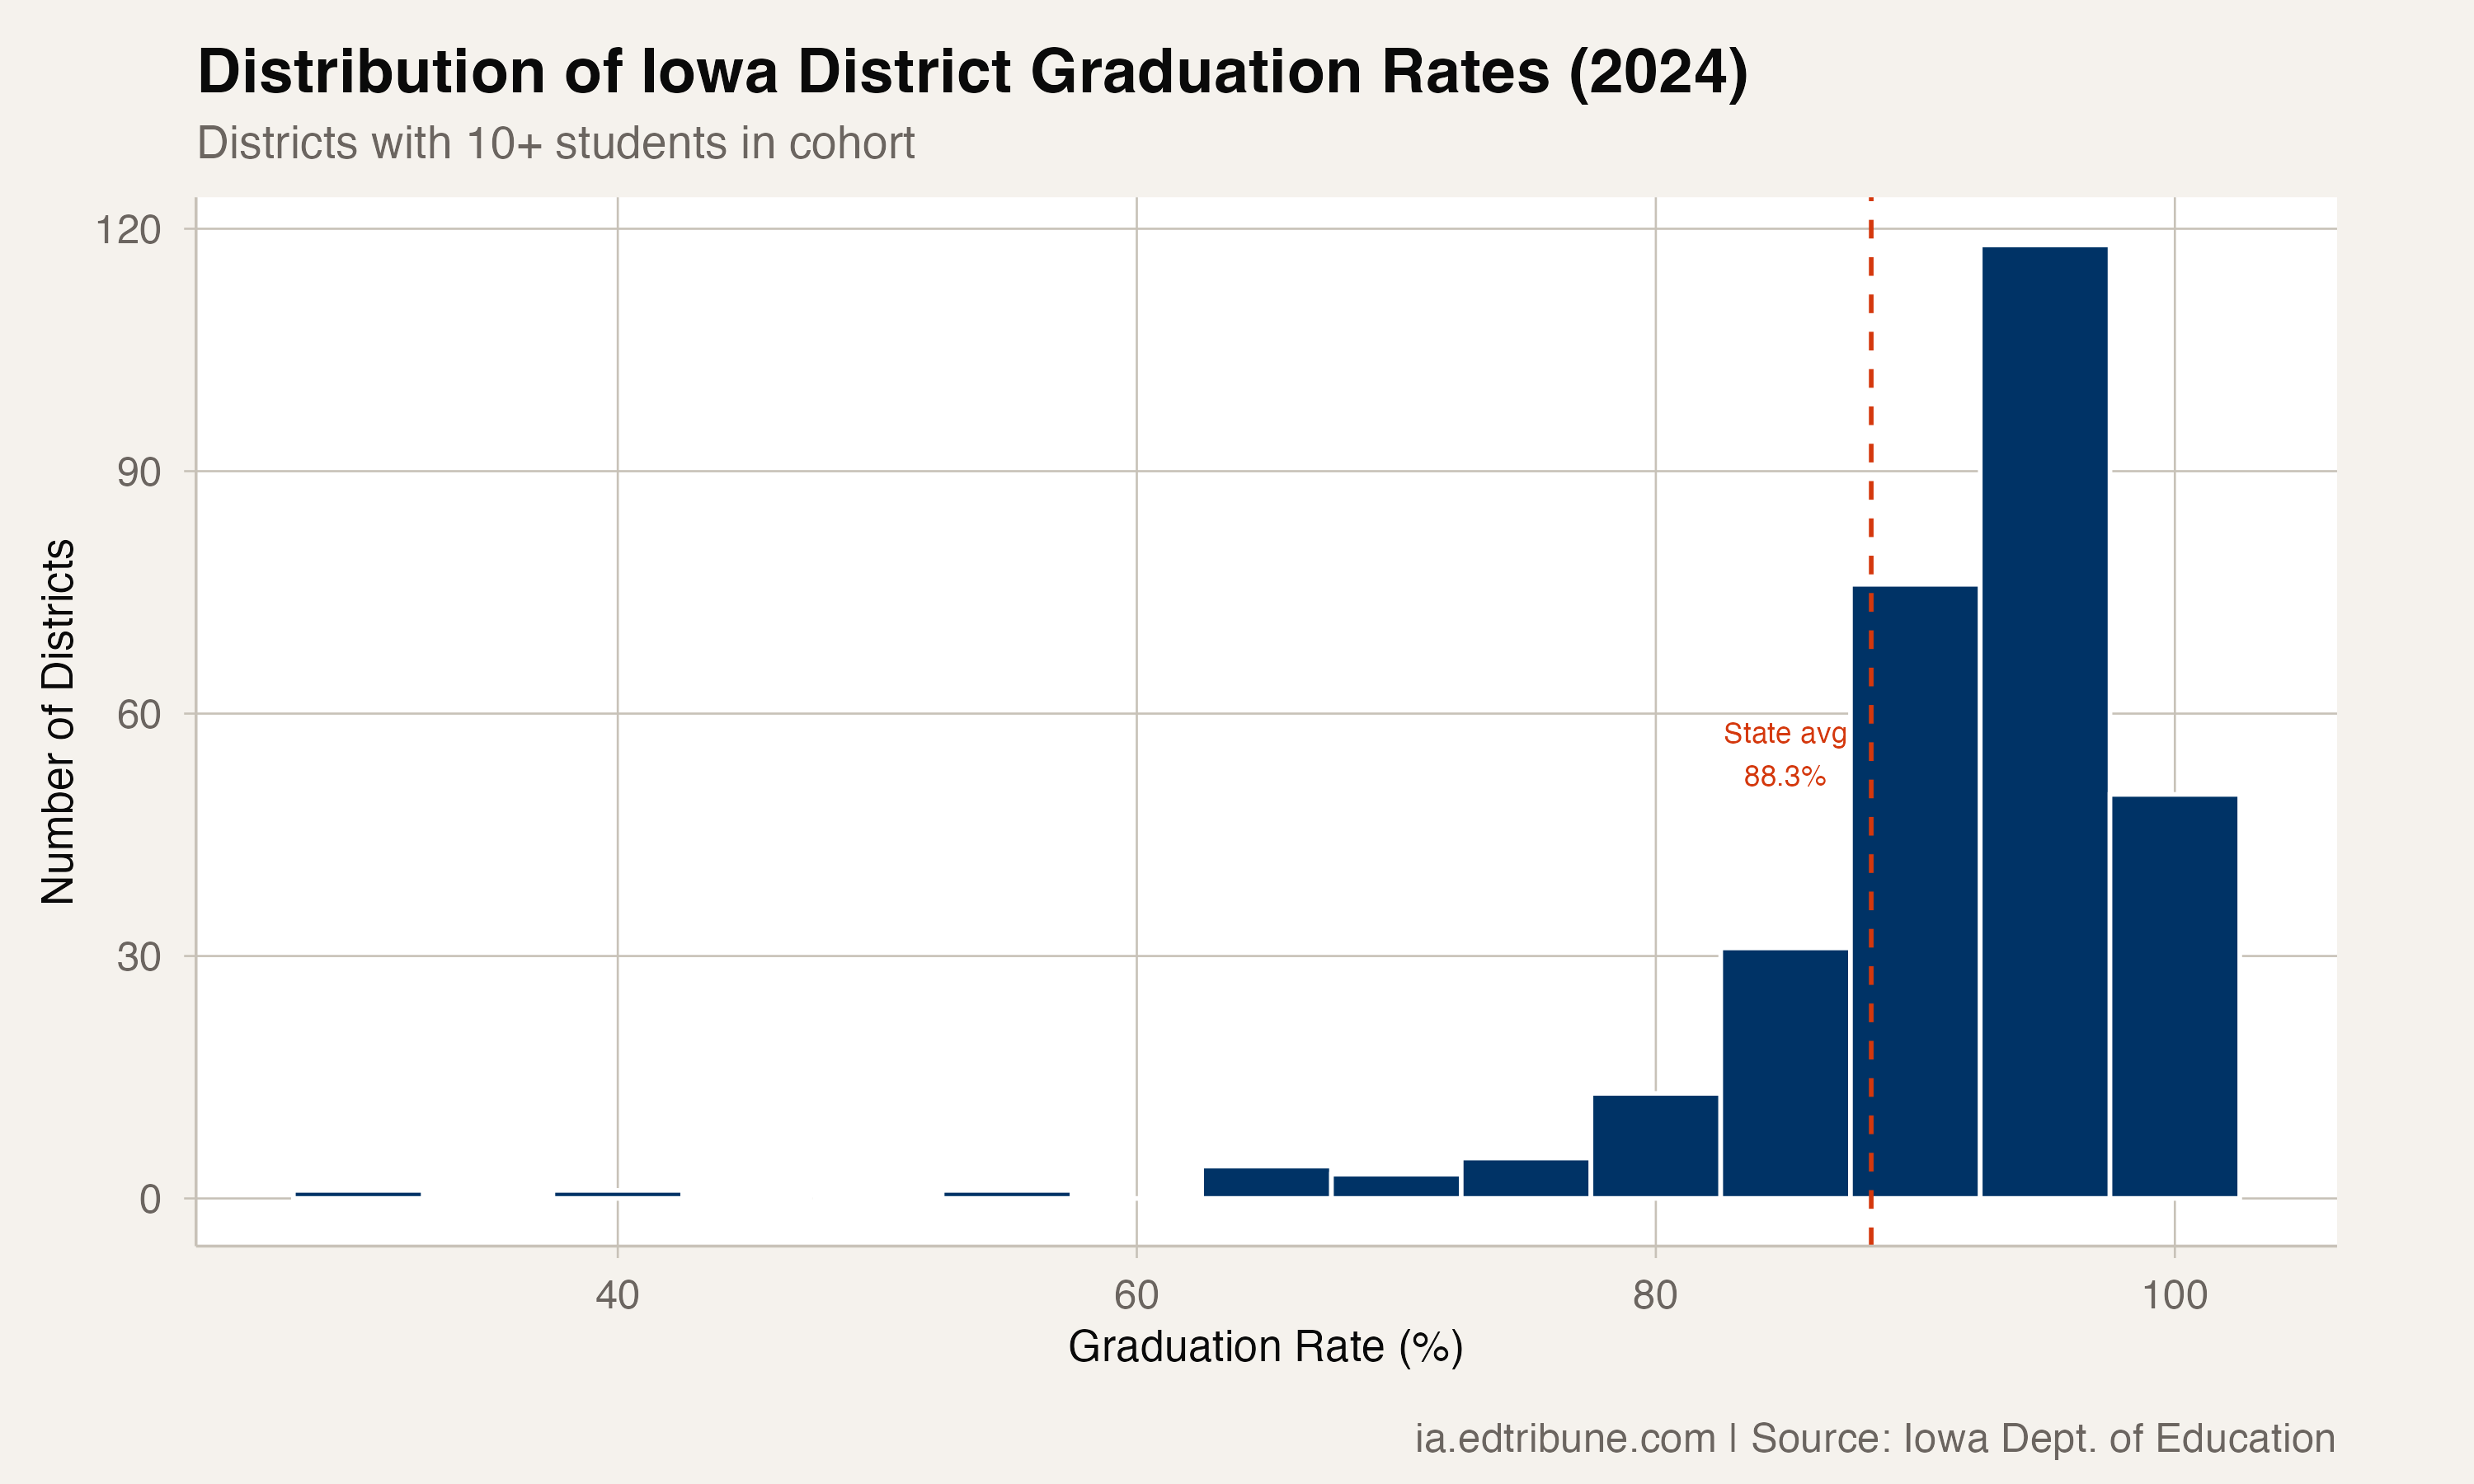
The state average of 88% falls in the middle of the main cluster. But the districts pulling the average down -- Storm Lake at 54%, Clayton Ridge at 63%, Oelwein at 67% -- are farther from the middle than the districts pushing it up. The distribution is not symmetric. It has a heavy left tail that the average does not reveal.
What the split means
A state where 46% of districts are at their best and 30% are at their worst is a state where the graduation problem is concentrating. The districts that are already strong are getting stronger. The districts that struggle are struggling more.
This is not a temporary divergence caused by the pandemic. By 2024, the pandemic's direct effects on graduation have largely washed through. The Class of 2024 entered high school in fall 2020 -- they experienced the worst of COVID disruption as freshmen, then had three relatively normal years. The split in 2024 reflects structural differences between communities, not the lingering tail of a crisis.
Detailed code that reproduces the analysis and figures in this article is available exclusively to EdTribune subscribers.
Discussion
Sign in to join the discussion.
Loading comments...