This is part of the Iowa Graduation Rate series, examining trends in the Class of 2019-2024.
Correction (July 23, 2026): An earlier version said Des Moines serves more students than the four largest suburbs combined; those suburbs enroll more. It also gave the special education gap as 27 points below the district average (it is 28), the 2020 rate as 72% (73%), and Sioux City's 2024 rate as 87% (86%).
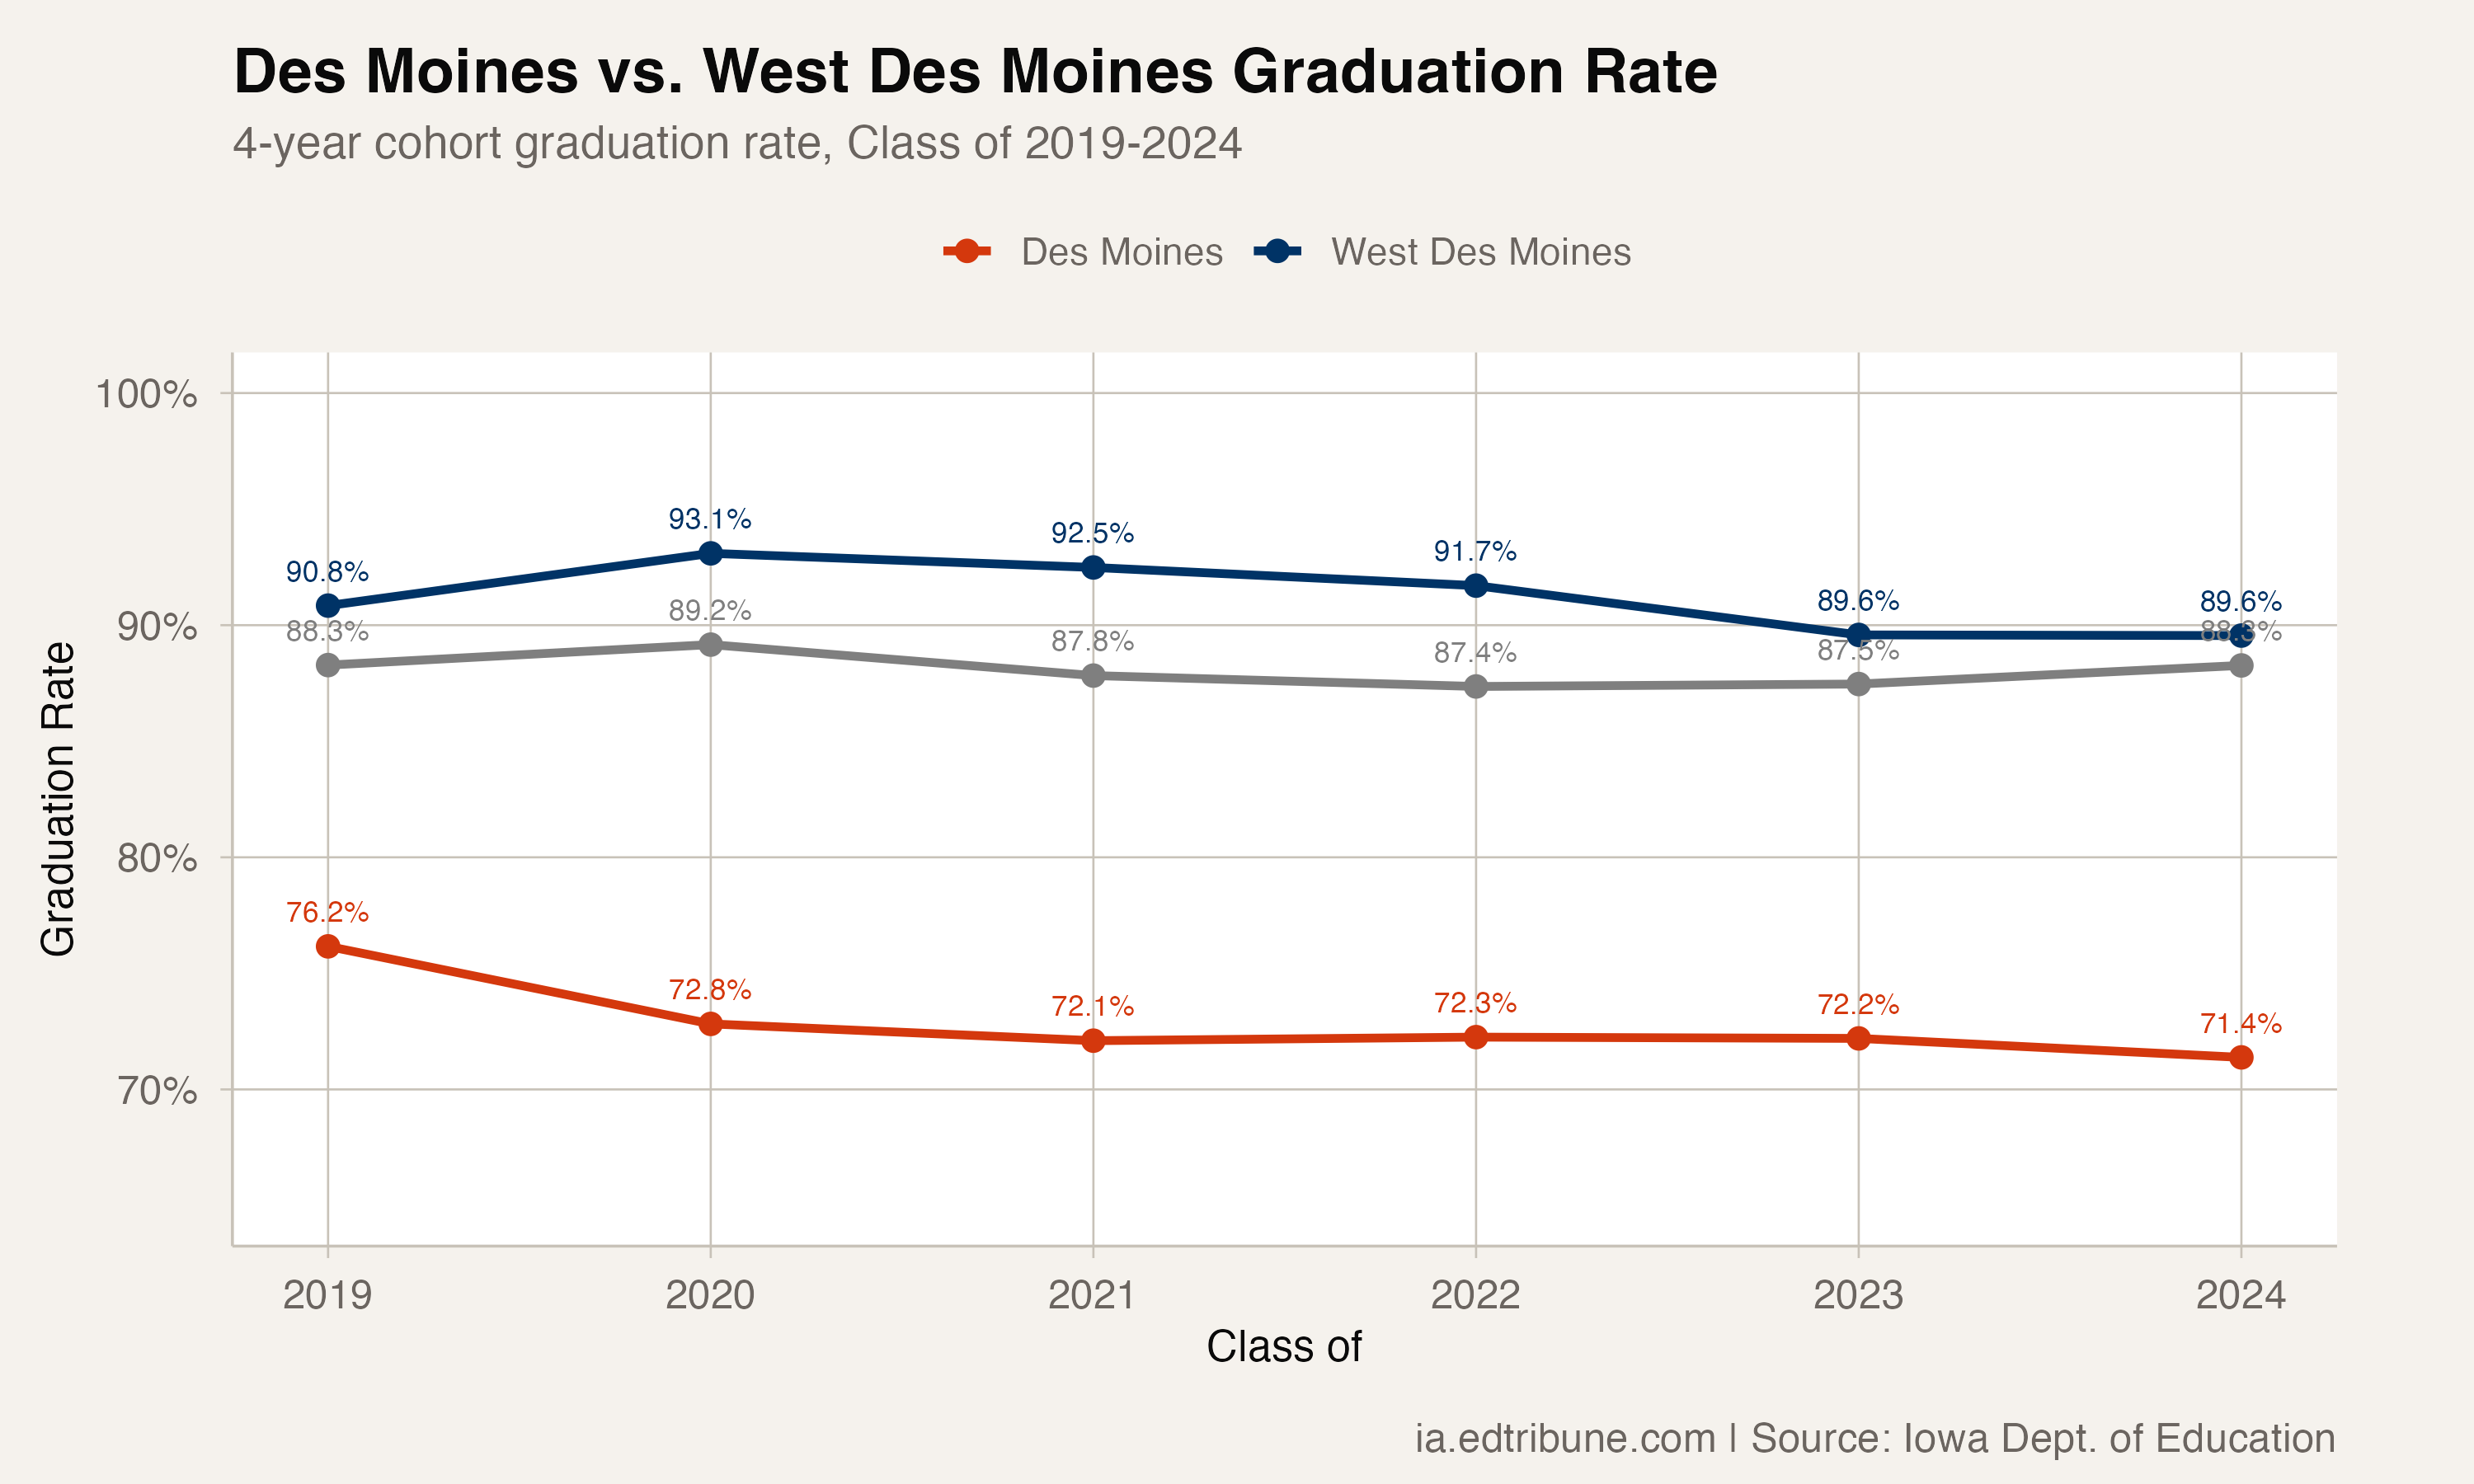
Des Moines Independent↗ET, the largest school district in Iowa, graduated 71% of its students in 2024. Five years earlier, it was 76%.
The decline has been steady and unrelenting. Not a single year since 2019 has matched the pre-pandemic rate. While Iowa's statewide graduation rate recovered to 88% -- exactly where it was before COVID -- the state capital has moved in the opposite direction.
The numbers land differently when you drive 15 minutes west. West Des Moines↗ET graduated 90% of its students. Waukee↗ET graduated 97%. Johnston↗ET graduated 97%.
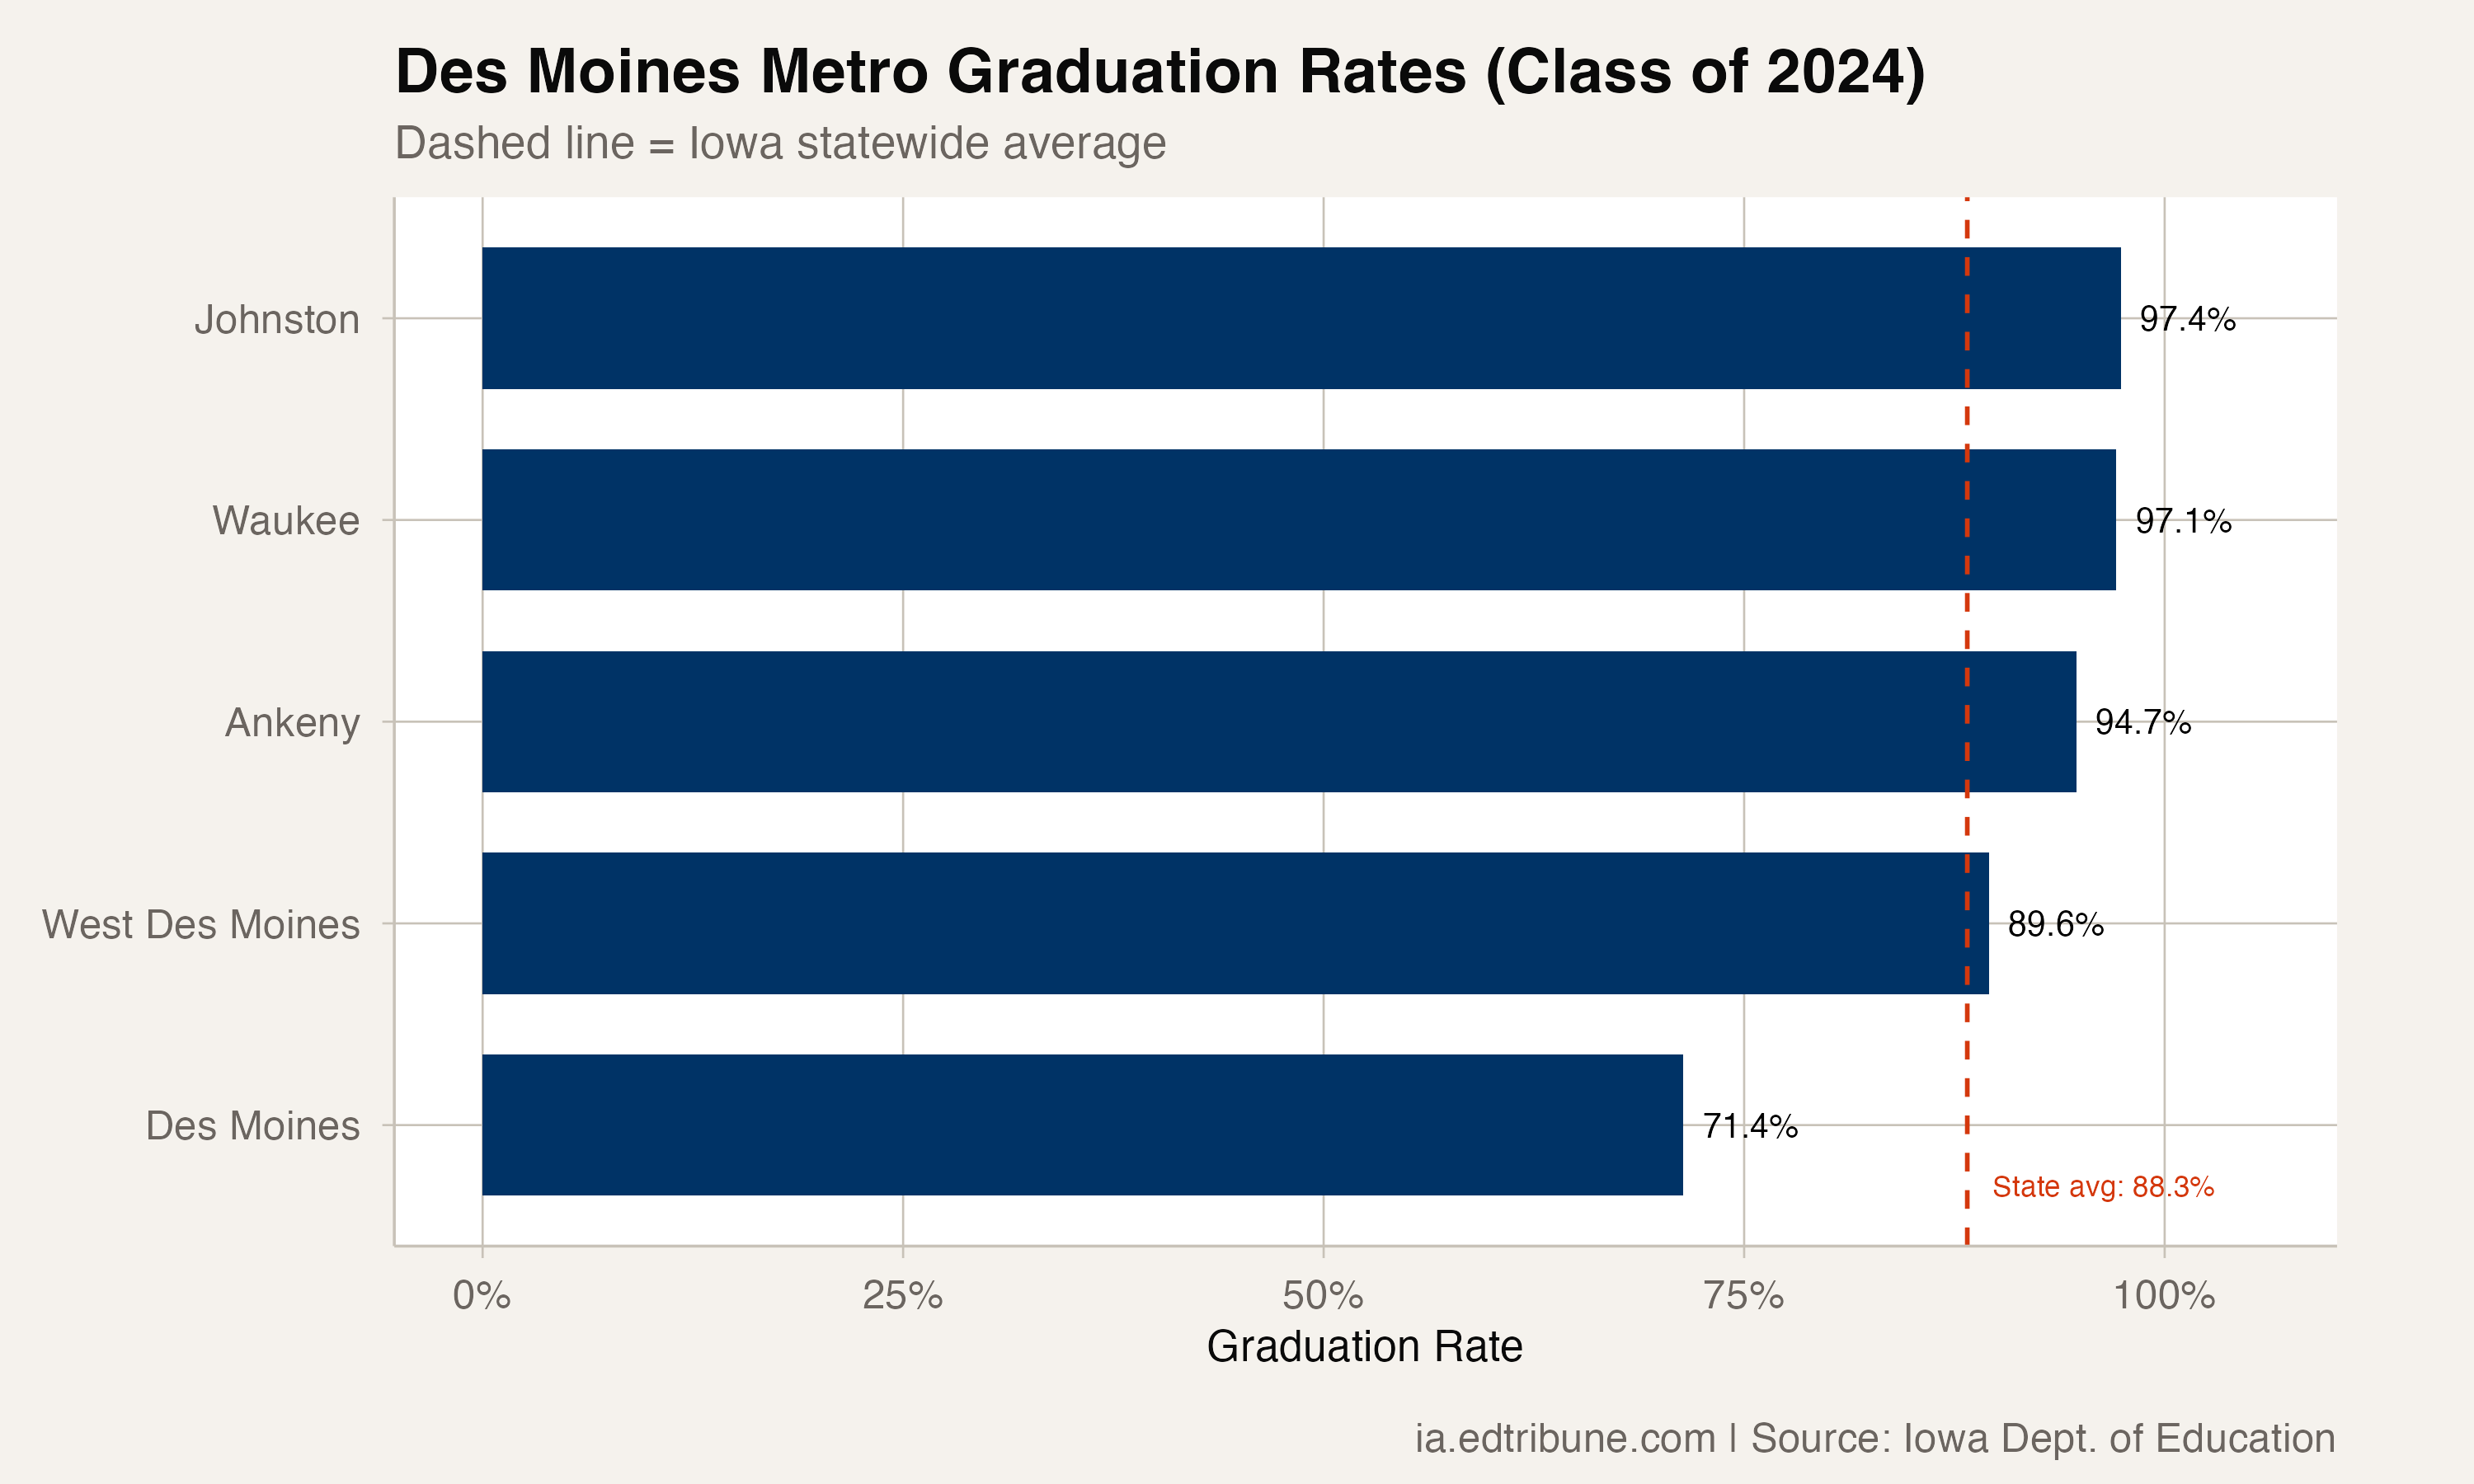
The gap between Des Moines and its suburbs is not a new phenomenon, but it has widened. The distance between Des Moines at 71% and Johnston at 97% is 26 percentage points -- meaning a student's odds of graduating on time shift dramatically depending on which side of a district boundary they live on.
A metro divided
The Des Moines metro tells a story about geography and resources. The five districts serving the metro area produced graduation rates spanning 26 points in 2024:
| District | Graduation Rate | Cohort Size |
|---|---|---|
| Johnston | 97.4% | 575 |
| Waukee | 97.1% | 908 |
| Ankeny↗ET | 94.7% | 893 |
| West Des Moines | 89.6% | 737 |
| Des Moines | 71.4% | 2,369 |
Des Moines' cohort of 2,369 is the largest in the state, meaning the district's struggles affect more students than any other single entity in Iowa.
Inside the numbers
Des Moines' overall rate masks even wider gaps among subgroups. Special education students graduated at 43% -- 28 points below the district average and 45 points below the state average. English learners graduated at 57%. Economically disadvantaged students -- who make up 83% of the cohort -- graduated at 67%.
The racial gaps within Des Moines are substantial. White students graduated at 77%, below the state average but well above the district's Black students at 67% and Hispanic students at 67%.
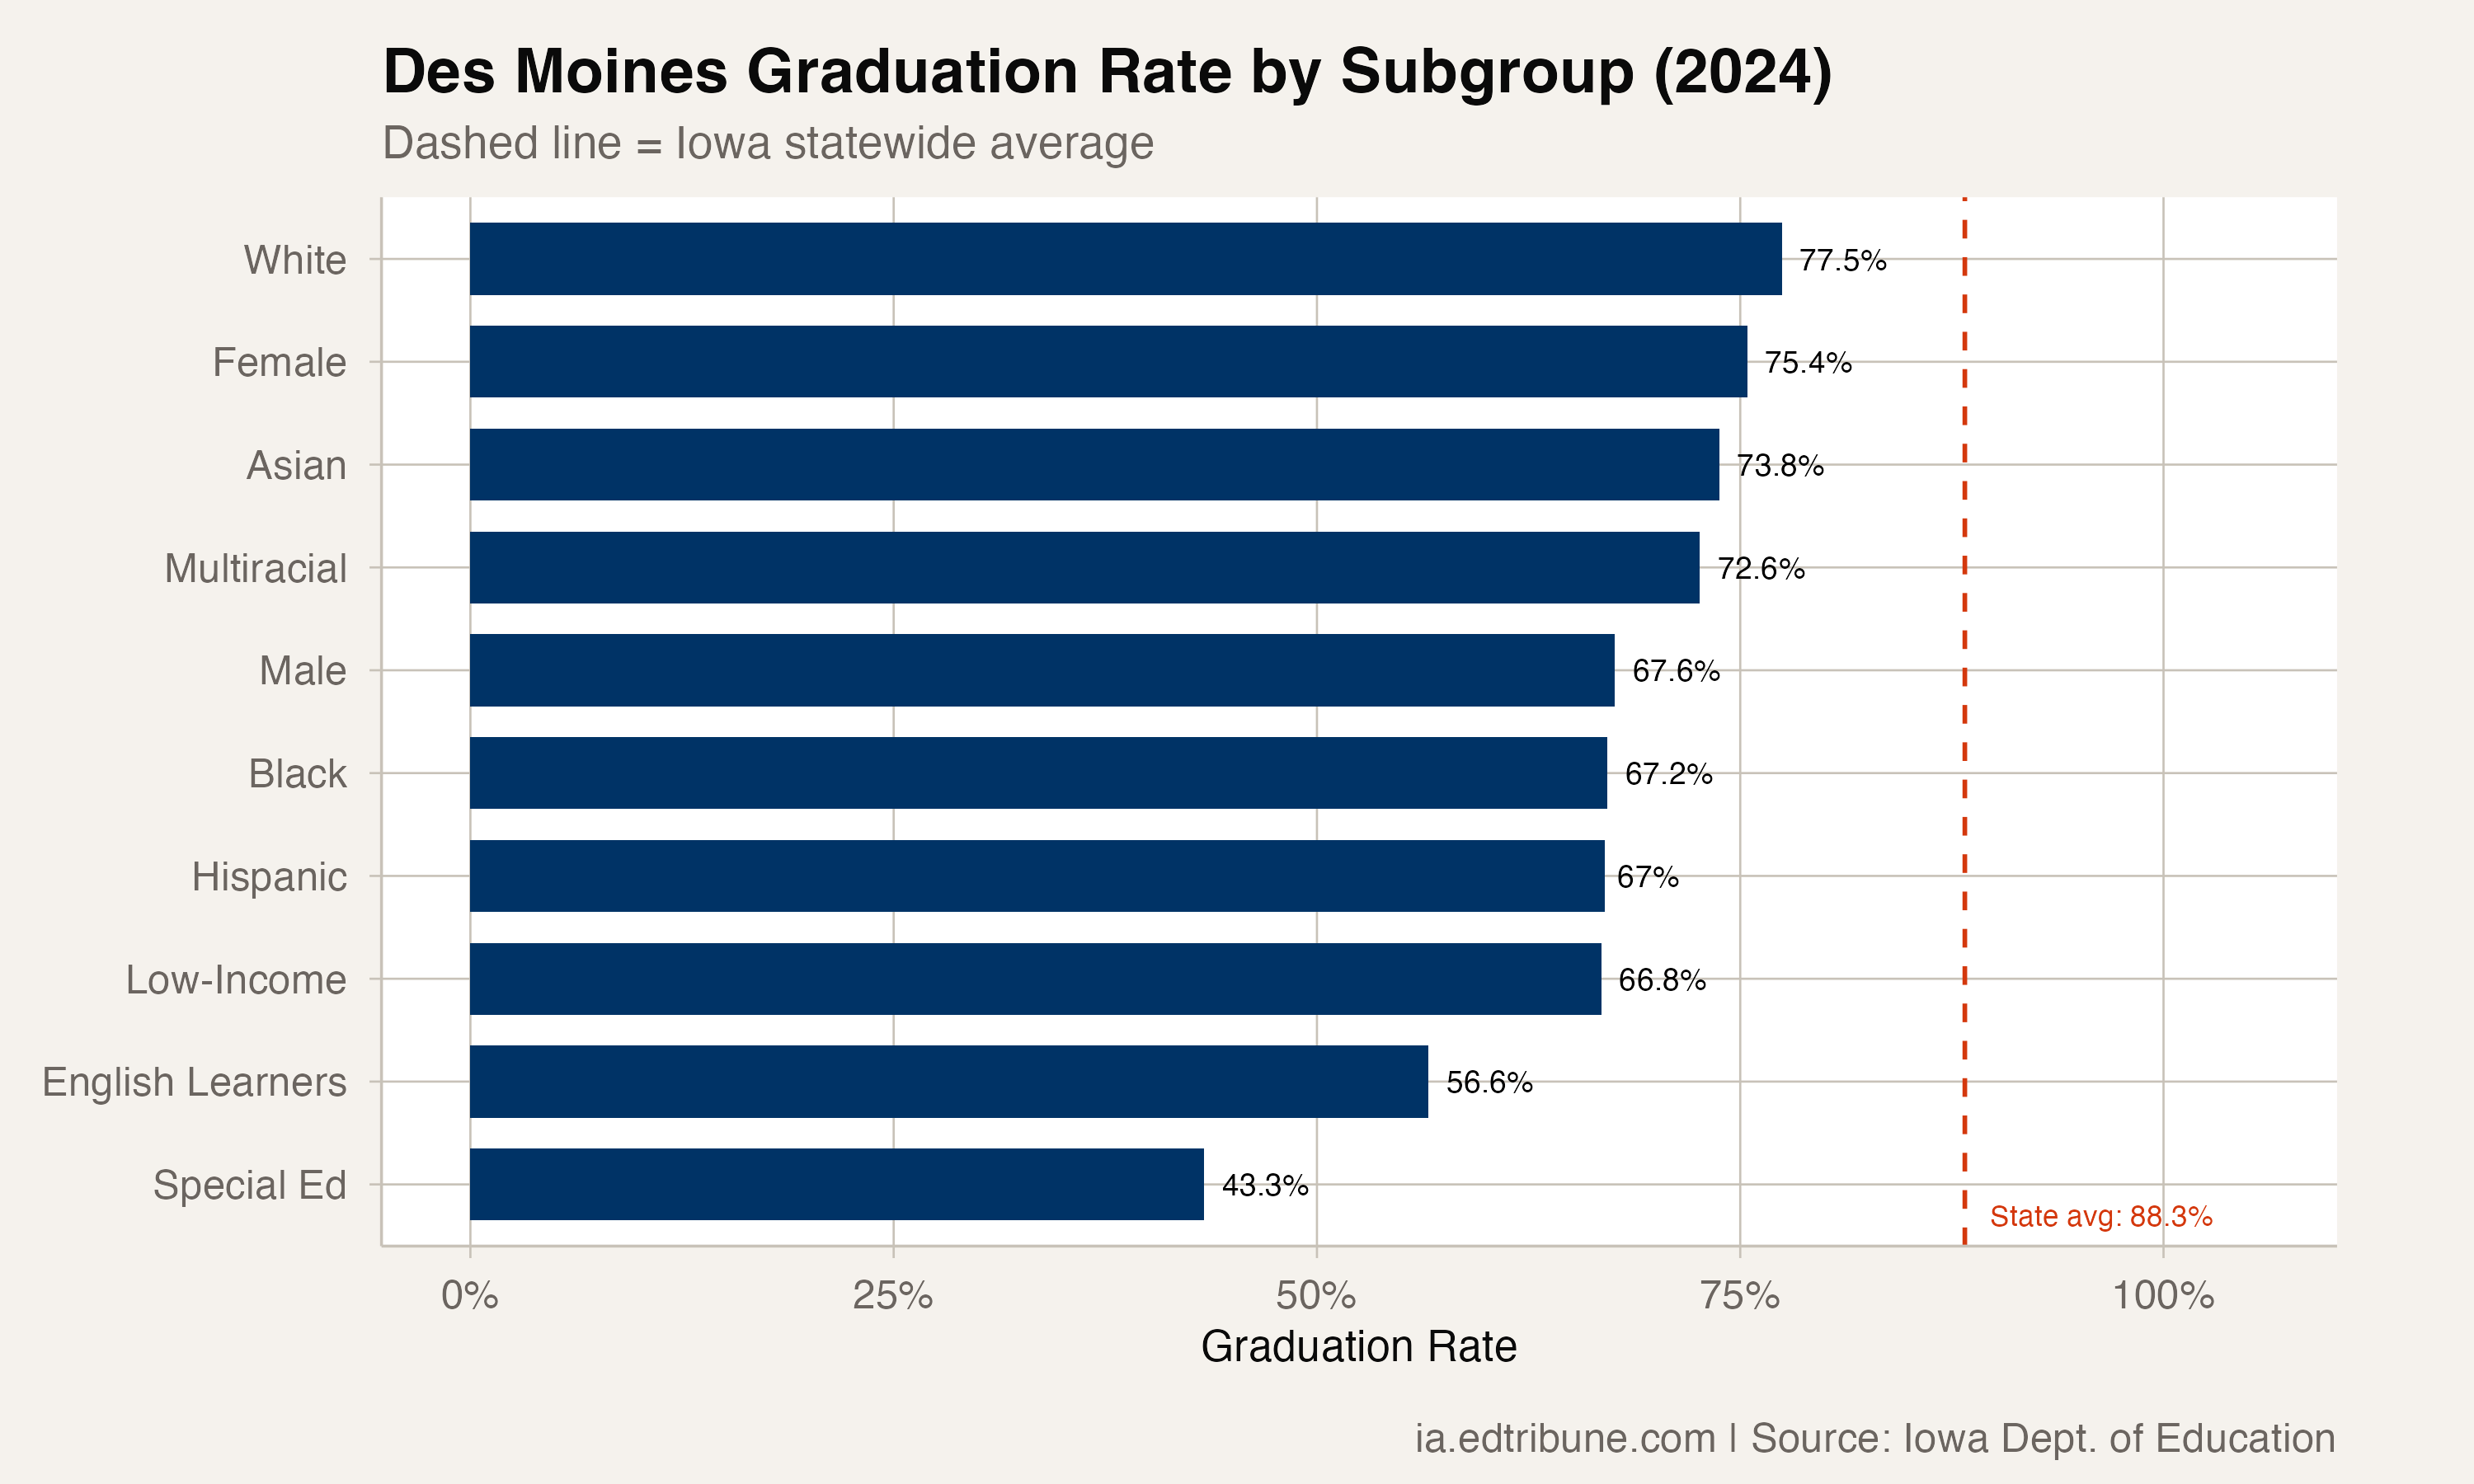
Males graduated at 68% compared to 75% for females -- a 7-point gender gap that mirrors the statewide pattern but is more pronounced in Des Moines.
How Des Moines compares to other cities
Des Moines' 71% rate is the lowest among Iowa's major urban districts. Cedar Rapids↗ET, the second-largest city, graduated 79%. Davenport↗ET graduated 78%. Even Waterloo↗ET, which faces many of the same demographic challenges, graduated 74%.
Iowa City, home to the University of Iowa, graduated 91% -- higher than the state average and 20 points above Des Moines. Council Bluffs, Sioux City, and Cedar Rapids all outperform the capital.
The comparison with Iowa City is instructive because it illustrates how much context matters. Iowa City's student body is shaped by a university community with high educational expectations. Des Moines serves the broadest cross-section of the state's urban population, including large communities of refugees and recent immigrants.
A trajectory with no inflection point
What distinguishes Des Moines' pattern is the absence of recovery. Other Iowa cities dipped during the pandemic and bounced back. Cedar Rapids dropped from 77% to 76% in 2021 and climbed to 79% by 2024. Davenport recovered from its COVID low. Sioux City bounced back to 86%.
Des Moines dropped from 76% in 2019 to 73% in 2020 and has stayed between 71% and 72% ever since. Four consecutive years of essentially flat performance at a depressed level suggests a structural challenge, not a temporary setback.
With a cohort of 2,369 students, the gap between Des Moines' 71% and the state average of 88% represents roughly 400 students per year who start ninth grade in the state capital and do not graduate on time.
Detailed code that reproduces the analysis and figures in this article is available exclusively to EdTribune subscribers.
Discussion
Sign in to join the discussion.
Loading comments...