This is part of the Iowa Graduation Rate series, examining trends in the Class of 2019-2024.
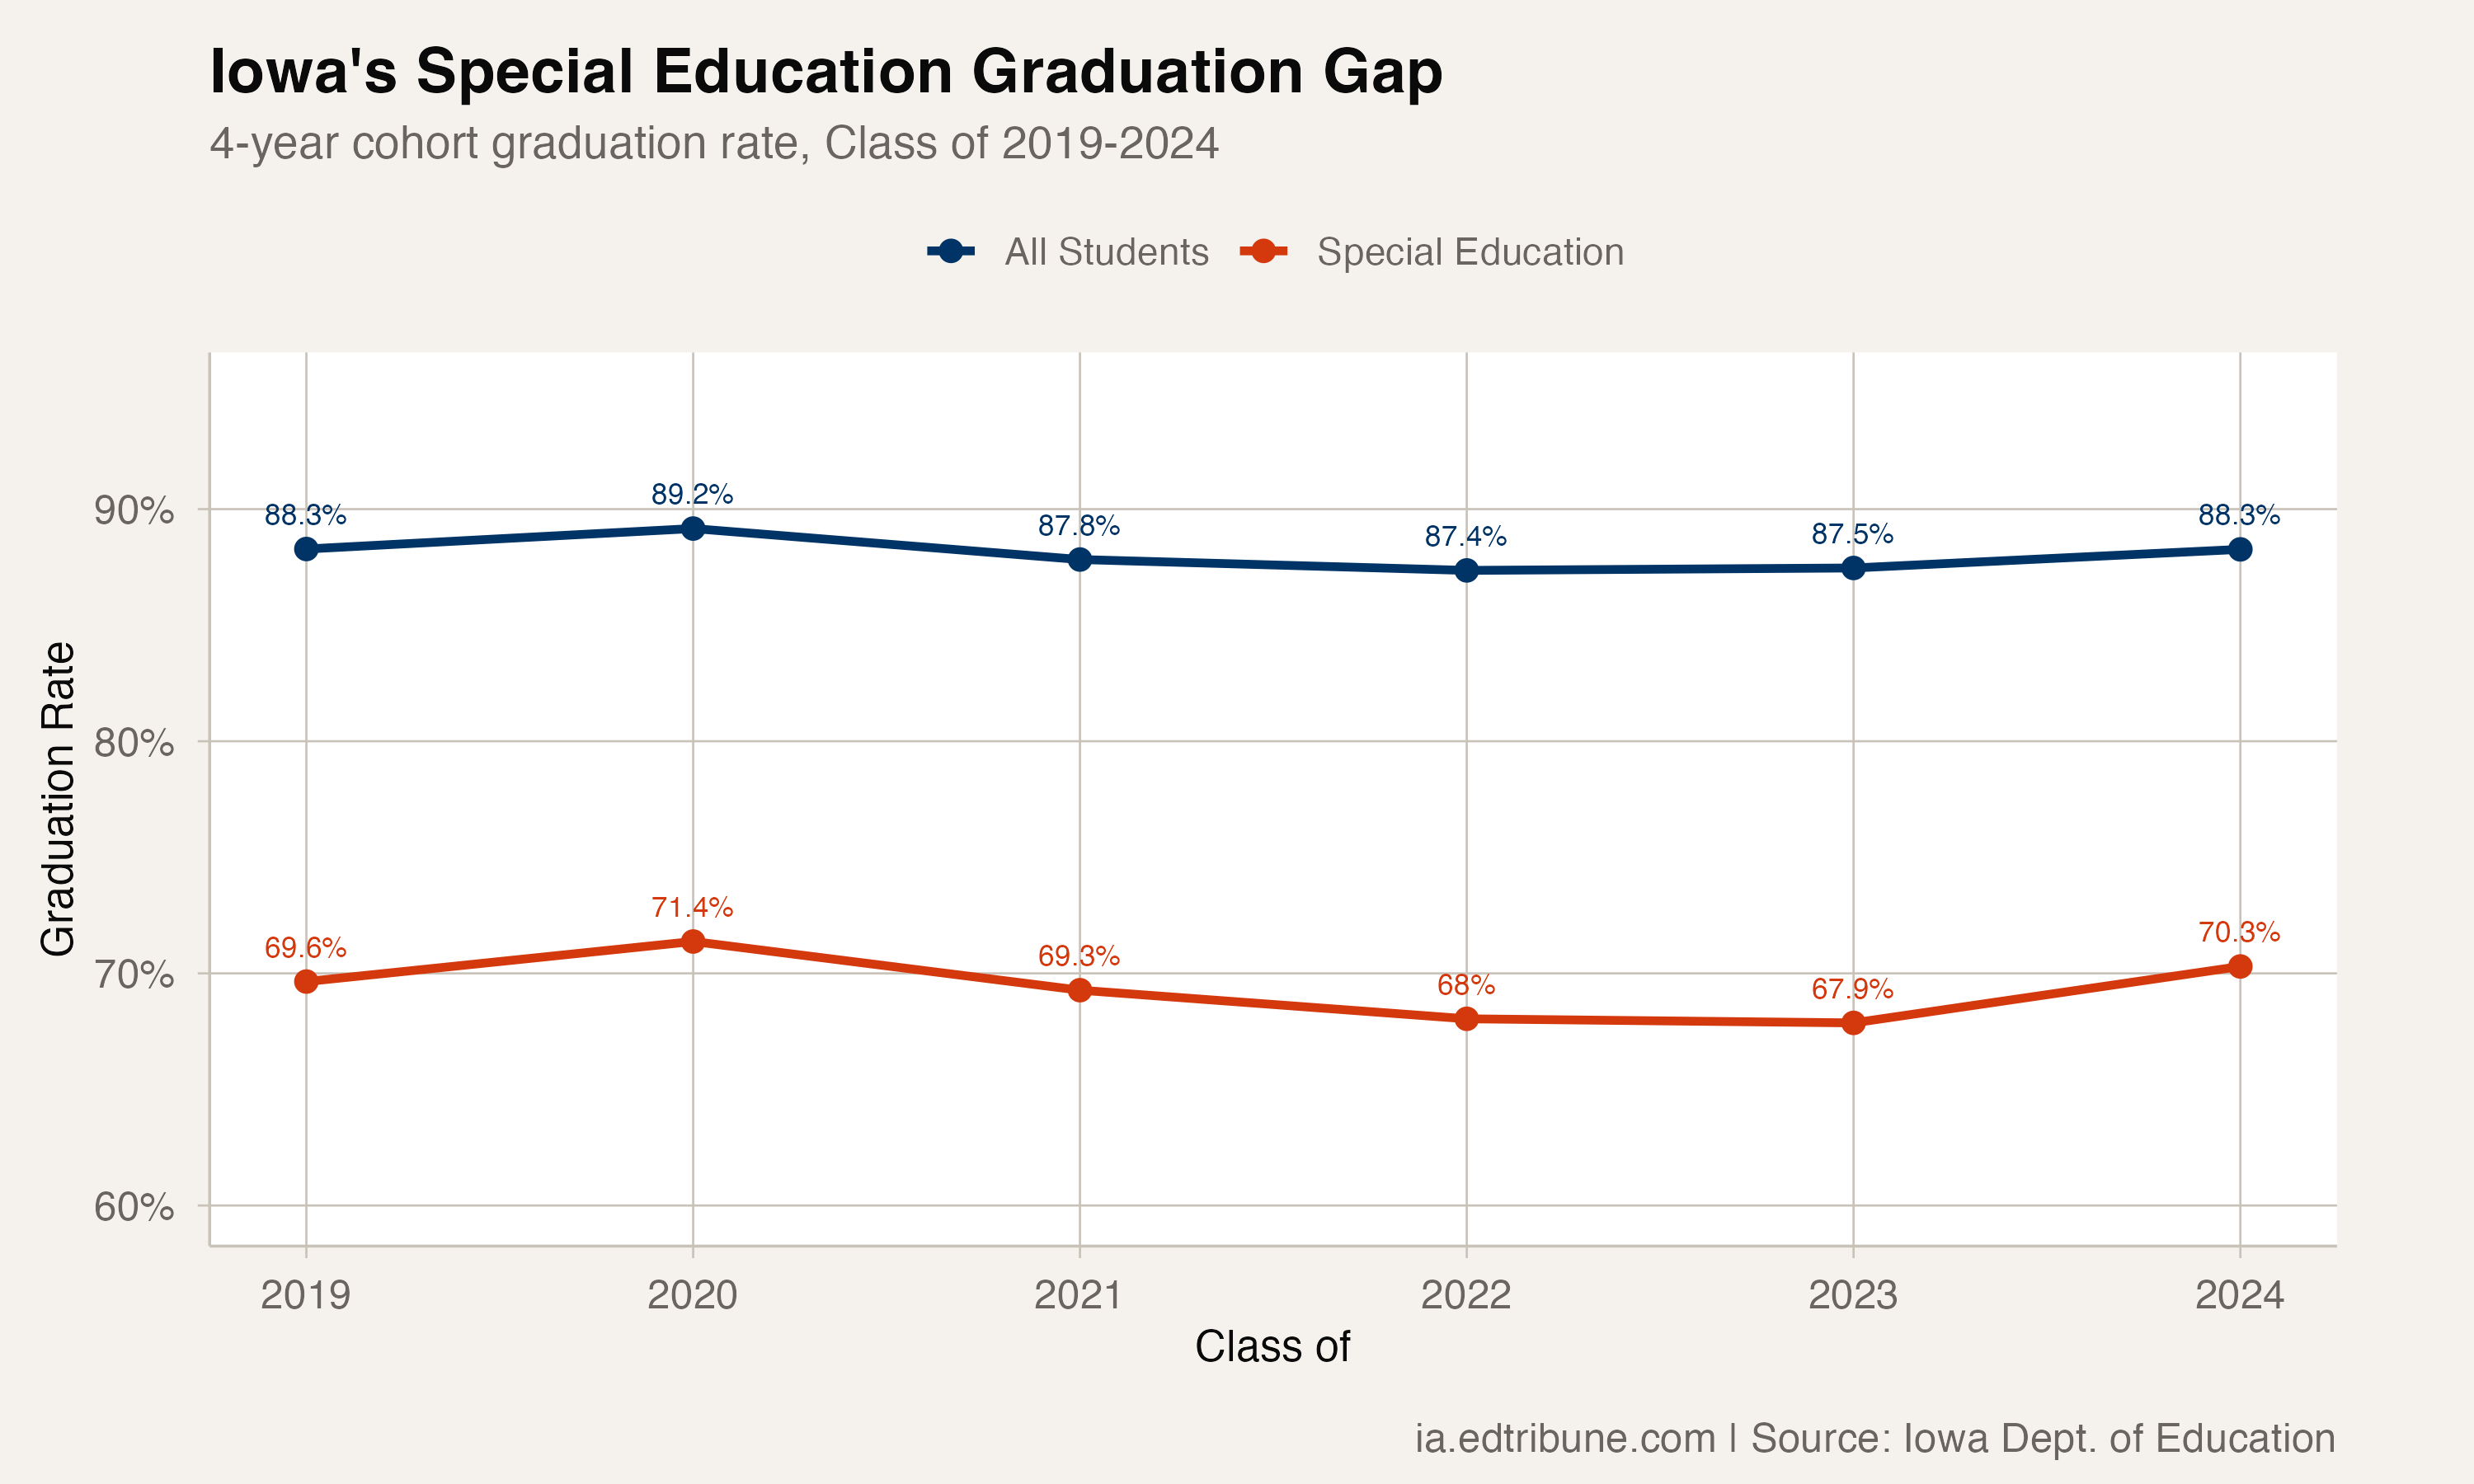
Special education students in Iowa graduated at 70% in 2024. The statewide average was 88%. The 18-point gap between the two is the widest equity divide in Iowa's graduation data after Native American students -- and unlike that gap, this one has barely moved.
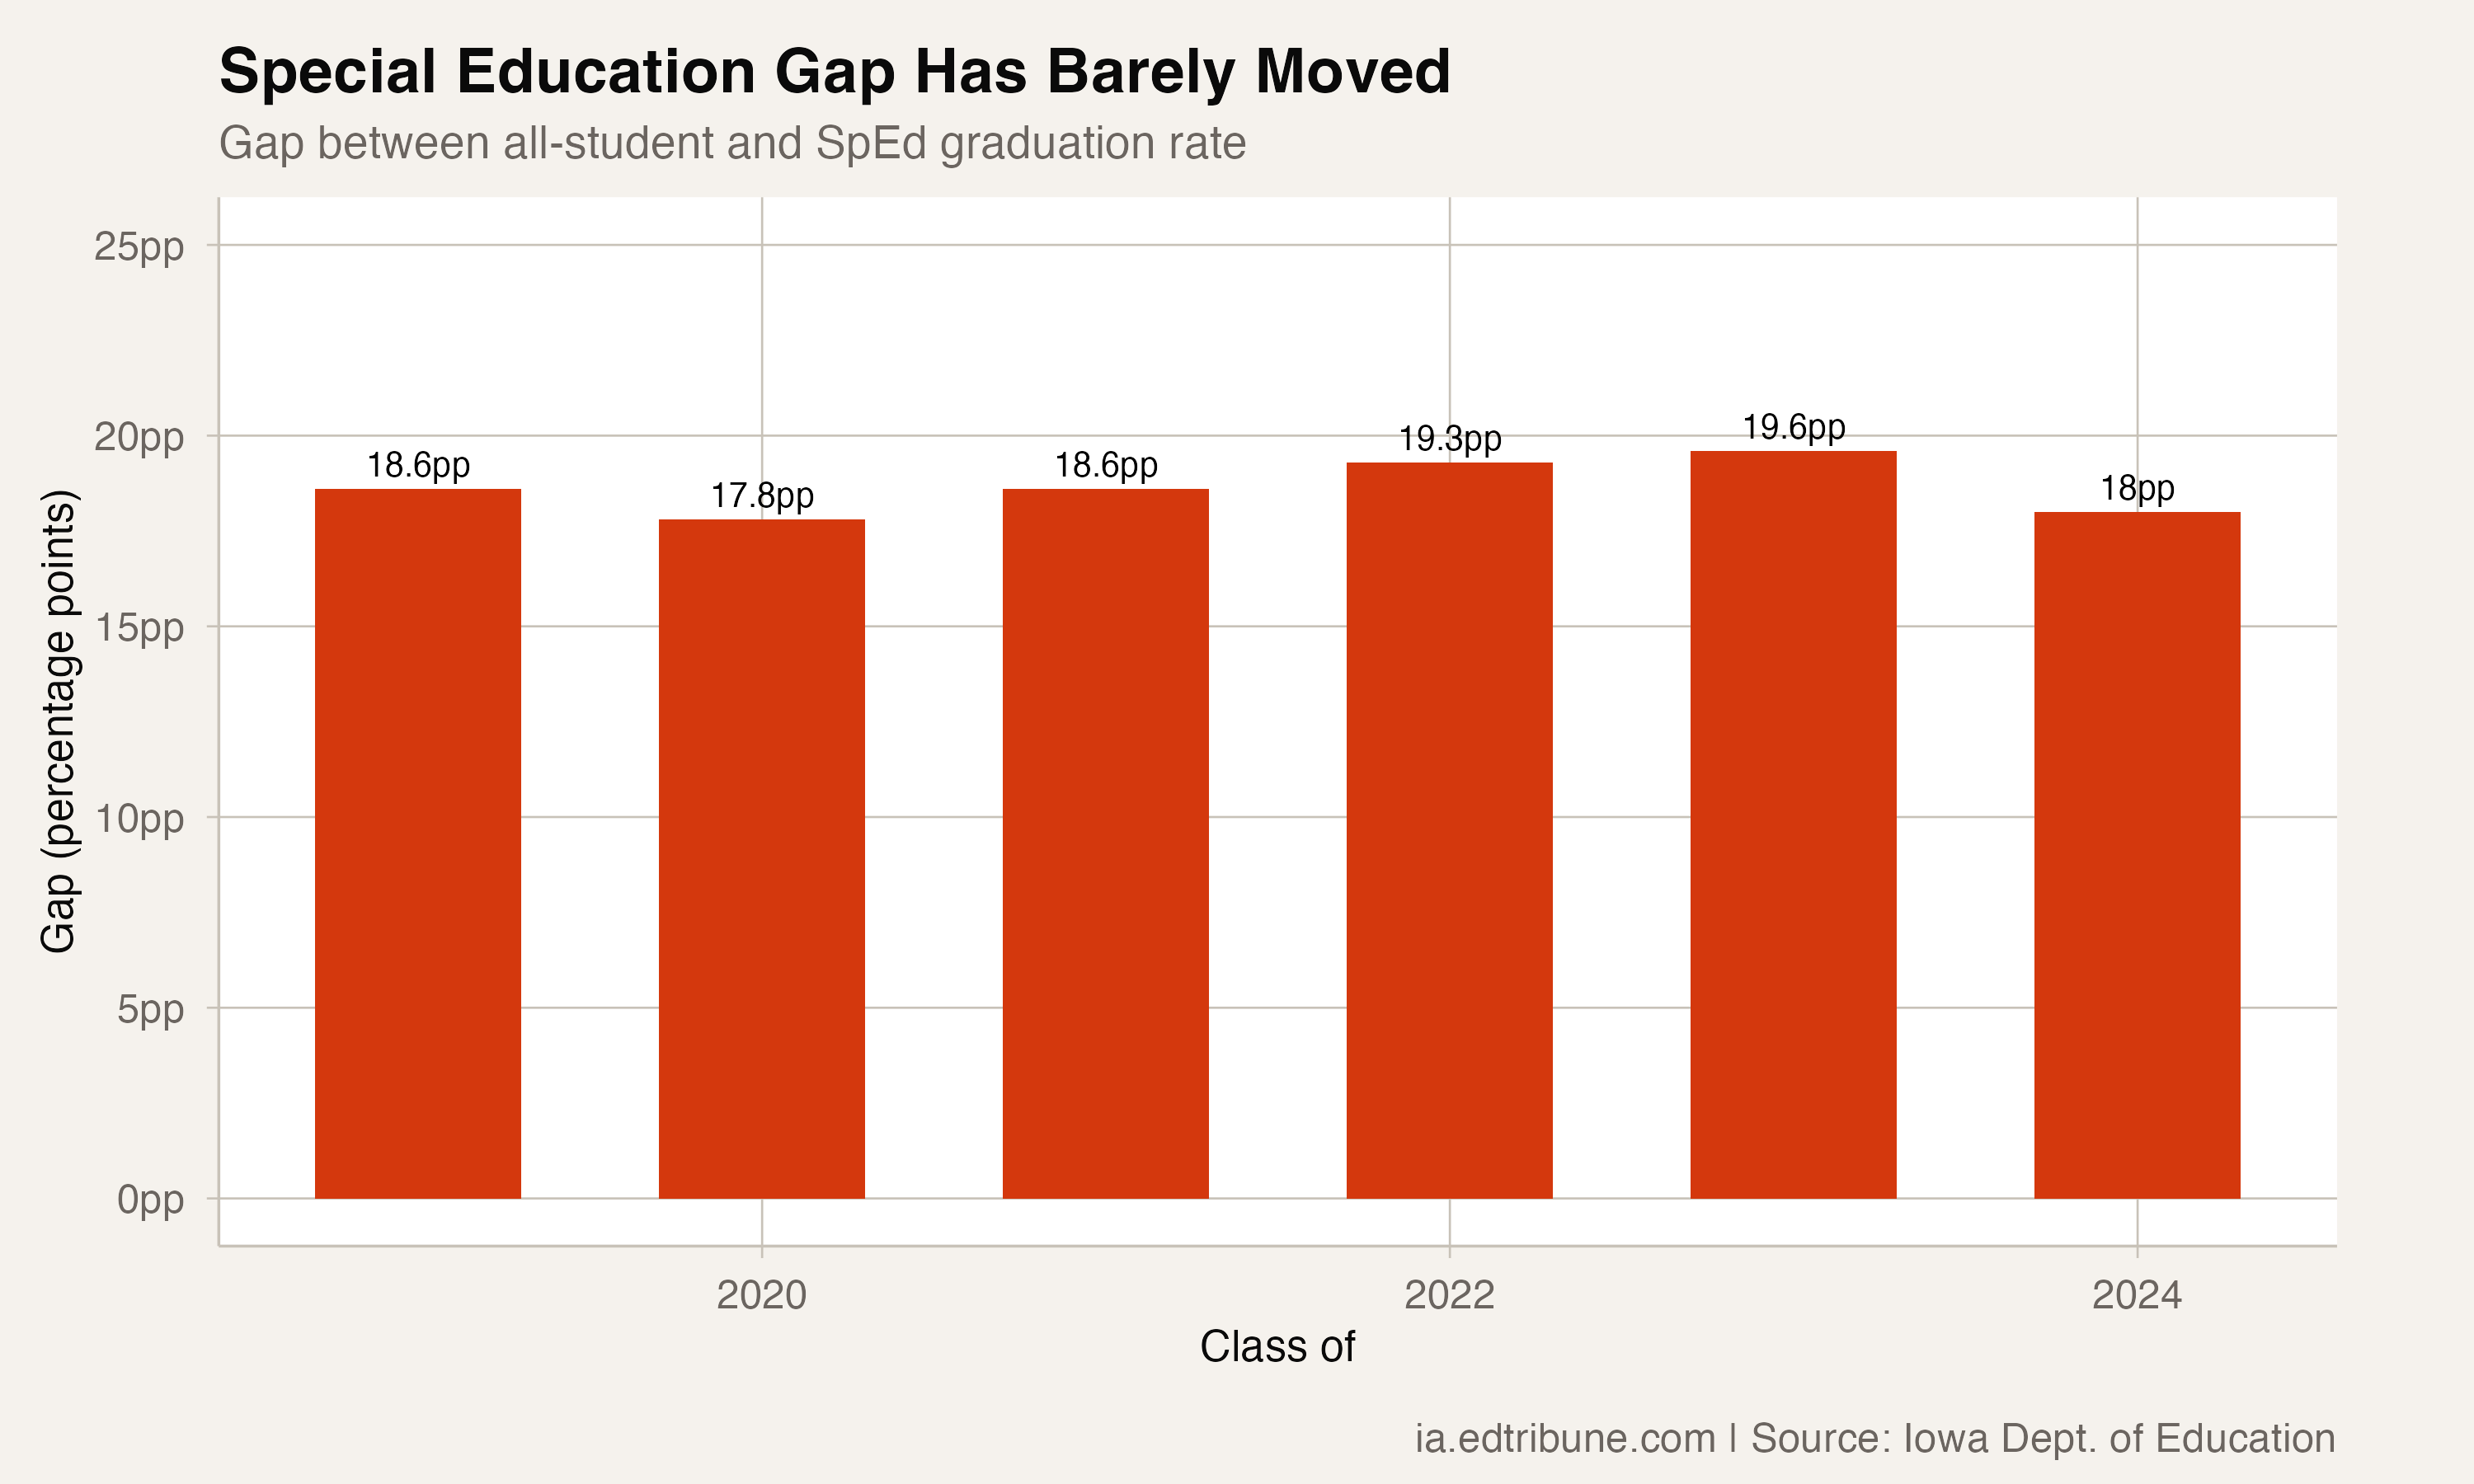
Over six years of available data, the special education gap has ranged from a low of 17.8 points to a high of 19.6 points. There has been no year of meaningful progress and no year of meaningful regression. The gap simply persists.
A growing population, a frozen gap
The special education cohort has grown steadily, from 4,820 students in the Class of 2019 to 5,279 in the Class of 2024. That growth -- from 13.2% to 13.6% of the total cohort -- means more students are affected by a gap that shows no sign of closing.
| Class of | SpEd Rate | All Students | Gap |
|---|---|---|---|
| 2019 | 69.6% | 88.3% | 18.6pp |
| 2020 | 71.4% | 89.2% | 17.8pp |
| 2021 | 69.3% | 87.8% | 18.6pp |
| 2022 | 68.0% | 87.4% | 19.3pp |
| 2023 | 67.9% | 87.5% | 19.6pp |
| 2024 | 70.3% | 88.3% | 18.0pp |
The 2024 rate of 70.3% represents a modest bounce from the 2022-2023 trough, when special education graduation dipped below 68%. But the recovery only returned the rate to approximately where it was in 2019. Special education students, like the state as a whole, are back to pre-pandemic levels -- which were already inadequate.
Wider than every other gap
The special education gap exceeds every other measured equity divide in Iowa except for Native American students (20 points below the state average) and Pacific Islander students (19 points below). It is wider than the English learner gap (15 points), the Black student gap (12 points), the poverty gap (8 points), and the gender gap (2 points).
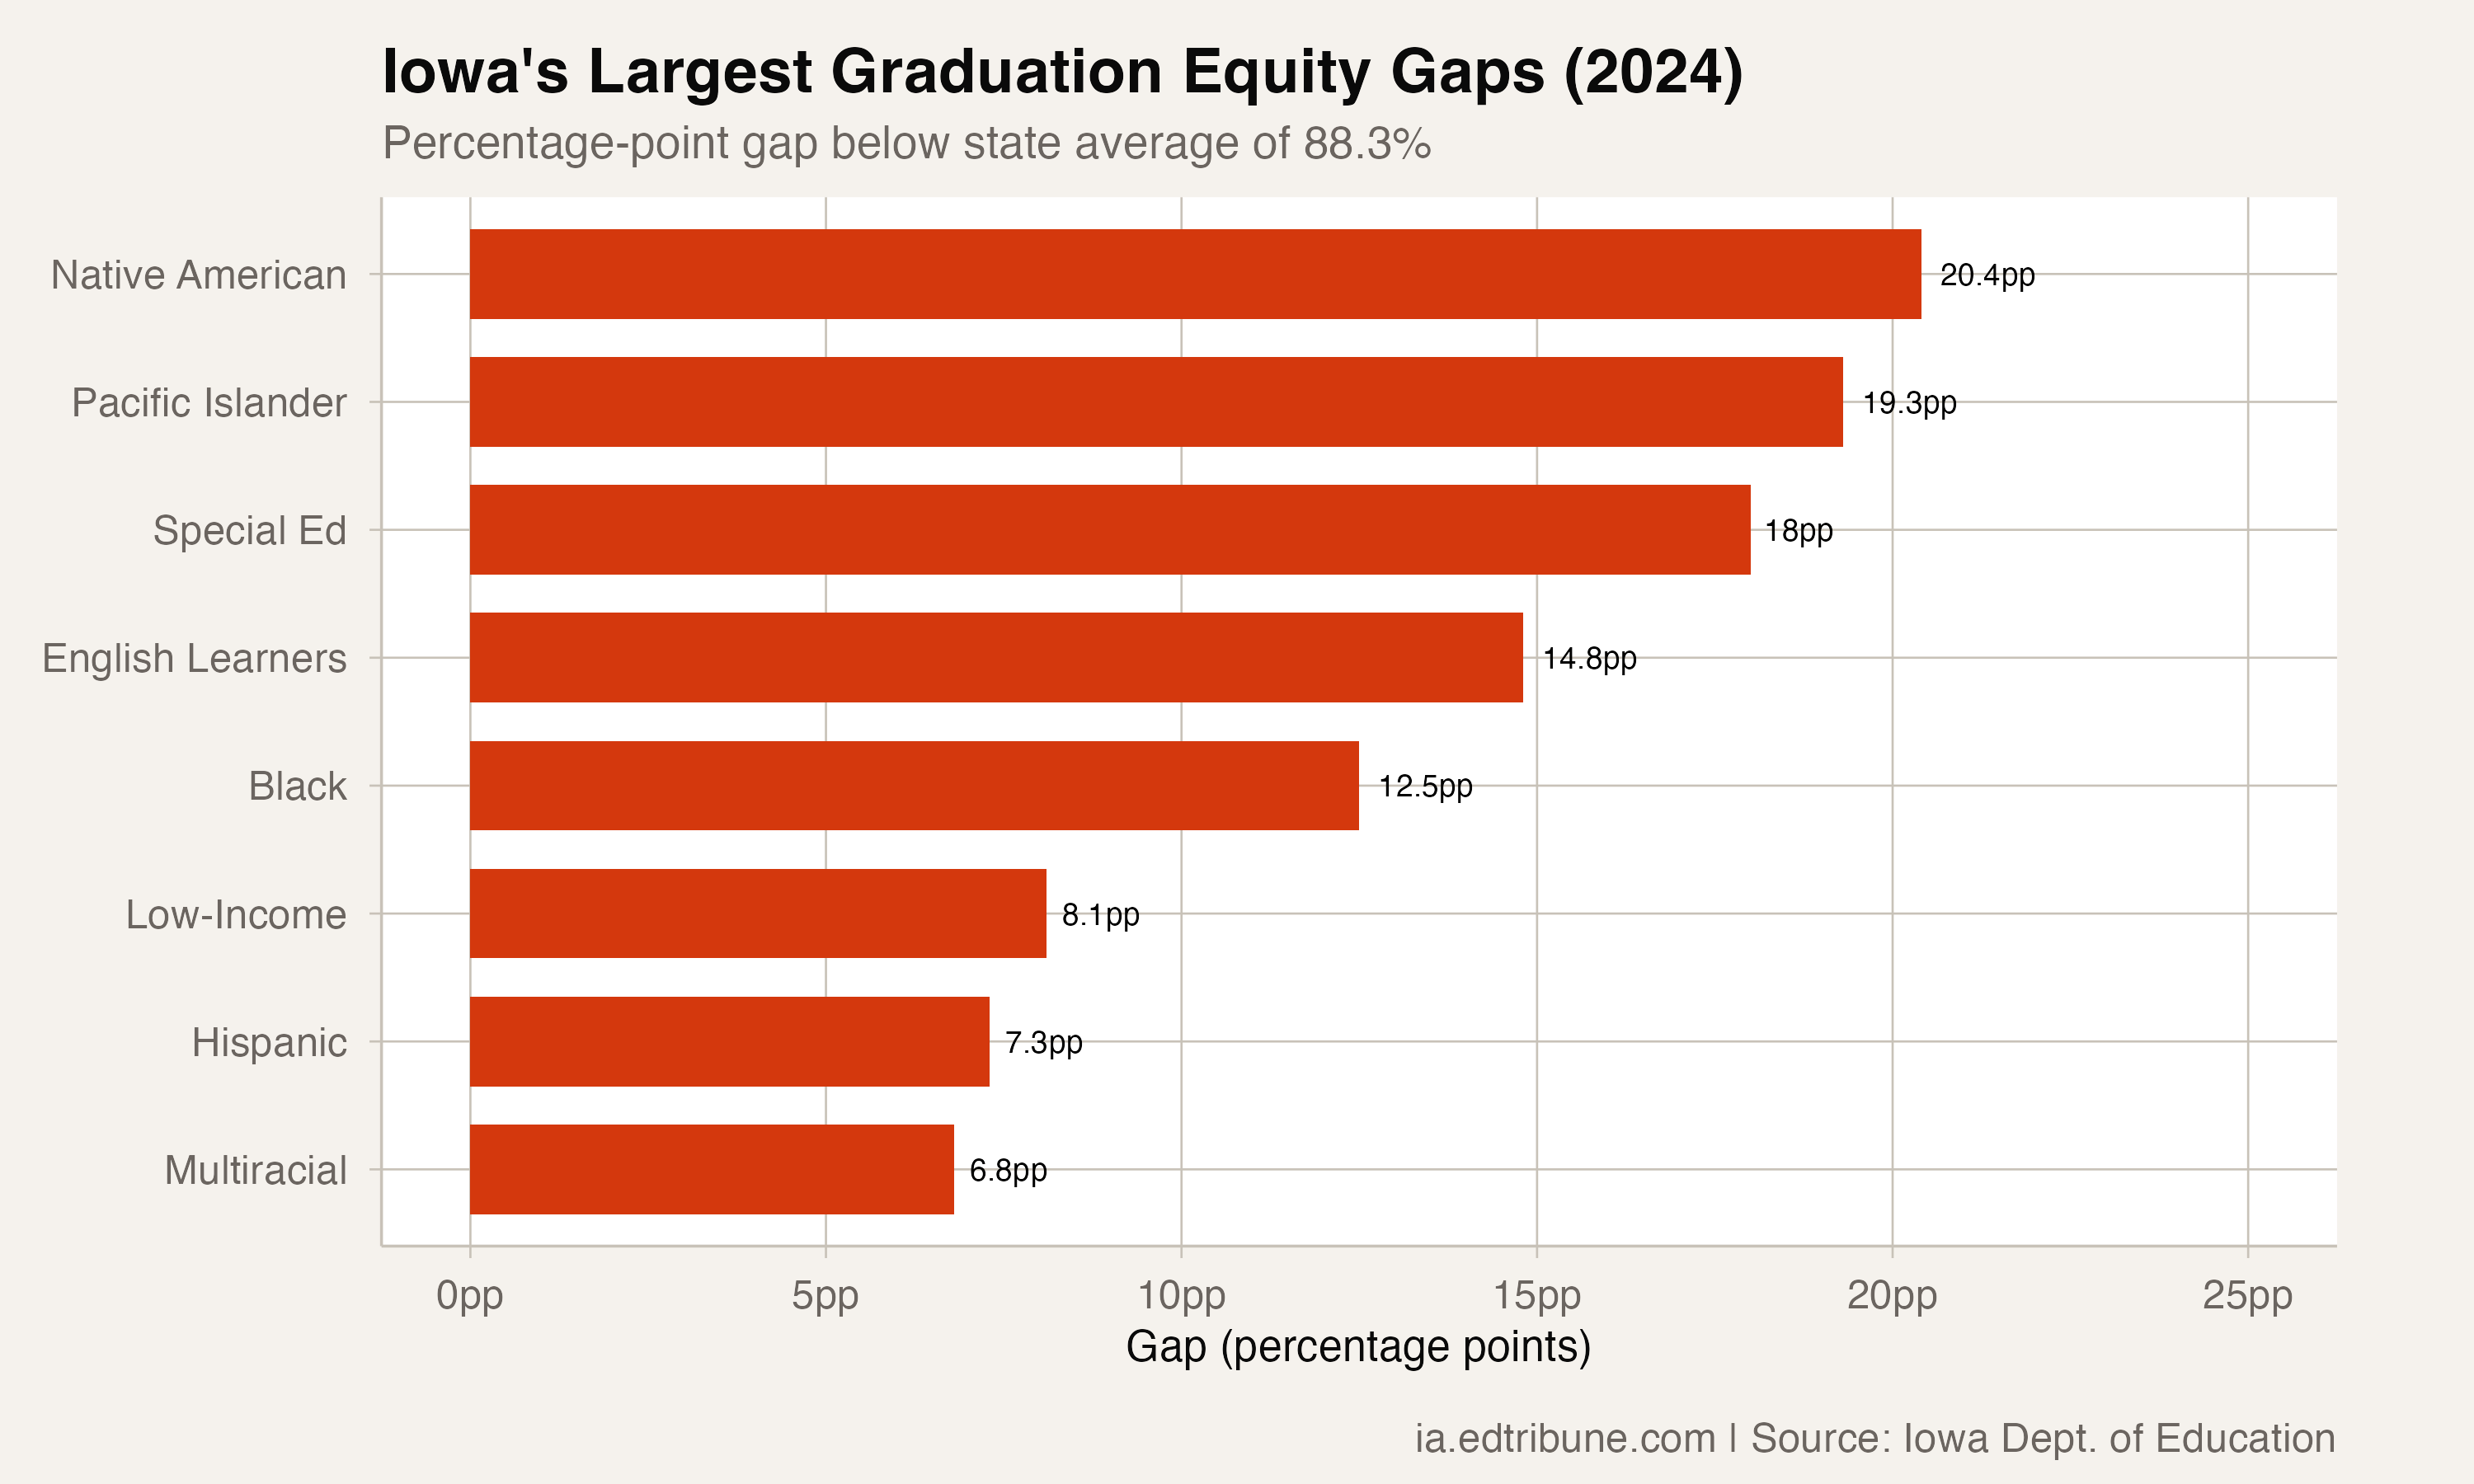
This ranking matters because it challenges assumptions about which groups face the steepest barriers. In public discourse about graduation gaps, race and poverty receive the most attention. The special education gap is larger than either and receives comparatively little scrutiny.
The district-level picture
The gap widens further in urban districts where special education cohorts are large enough to measure. In Des Moines↗ET, special education students graduated at 43% -- 28 points below the district average and 45 points below the state average. That rate comes from a cohort of 390 students, making it one of the most consequential special education outcomes in the state.
Burlington↗ET graduated special education students at 41%. Fort Dodge↗ET at 41%. Waterloo↗ET at 52%. Cedar Rapids↗ET at 52%.
Suburban districts fared better. Waukee↗ET graduated special education students at 81%. Southeast Polk↗ET at 83%. Western Dubuque at 93%. But these districts serve smaller special education cohorts, and the comparison makes clear how concentrated the challenge is in urban cores.
What the category contains
"Special education" is not a single population. The category includes students with learning disabilities, emotional behavioral disorders, autism spectrum conditions, intellectual disabilities, and physical impairments. A student with a mild learning disability and a student with a significant cognitive impairment are both counted in the same graduation rate, despite facing fundamentally different paths to a diploma.
Iowa's data does not disaggregate by disability type. The 70% rate is an aggregate that blends students who are on track to graduate with general-education coursework alongside students for whom a standard diploma may not be the most meaningful measure of educational success.
Some states report graduation by disability category or by educational placement (mainstream vs. self-contained). Iowa does not. Without that granularity, it is difficult to know whether the 70% rate reflects a broad failure across all disability types or a specific challenge concentrated among students with the most significant needs.
Nearly 1,600 students per year
At 70%, approximately 1,570 special education students in Iowa did not graduate on time in 2024. If the rate matched the state average, roughly 950 additional students would have earned diplomas.
With special education cohorts growing and the gap showing no movement, the absolute number of students affected increases each year. The gap is not getting worse in percentage terms, but it is getting worse in the number of lives it touches.
Detailed code that reproduces the analysis and figures in this article is available exclusively to EdTribune subscribers.
Discussion
Sign in to join the discussion.
Loading comments...