This is part of the Iowa Graduation Rate series, examining trends in the Class of 2019-2024.
Correction (July 23, 2026): An earlier version said Des Moines serves more students than the six suburban districts combined; those suburbs enroll more students than Des Moines. It also said Iowa City and Sioux City both exceeded the 88% state average; only Iowa City did, as Sioux City graduated 86%.
Drive west on Interstate 235 from downtown Des Moines to the suburb of West Des Moines↗ET and the graduation rate climbs 18 points. Drive another 10 minutes to Waukee↗ET and it climbs 26 points. Same metro area, same labor market, same Iowa cornfields on the horizon.
The suburban-urban graduation gap is not unique to Iowa, but the state's data exposes it with particular clarity. Iowa's metro areas are small enough that a single district boundary can separate a 71% graduation rate from a 97% graduation rate. The same pattern repeats across every major metro in the state.
Des Moines: 26 points from bottom to top
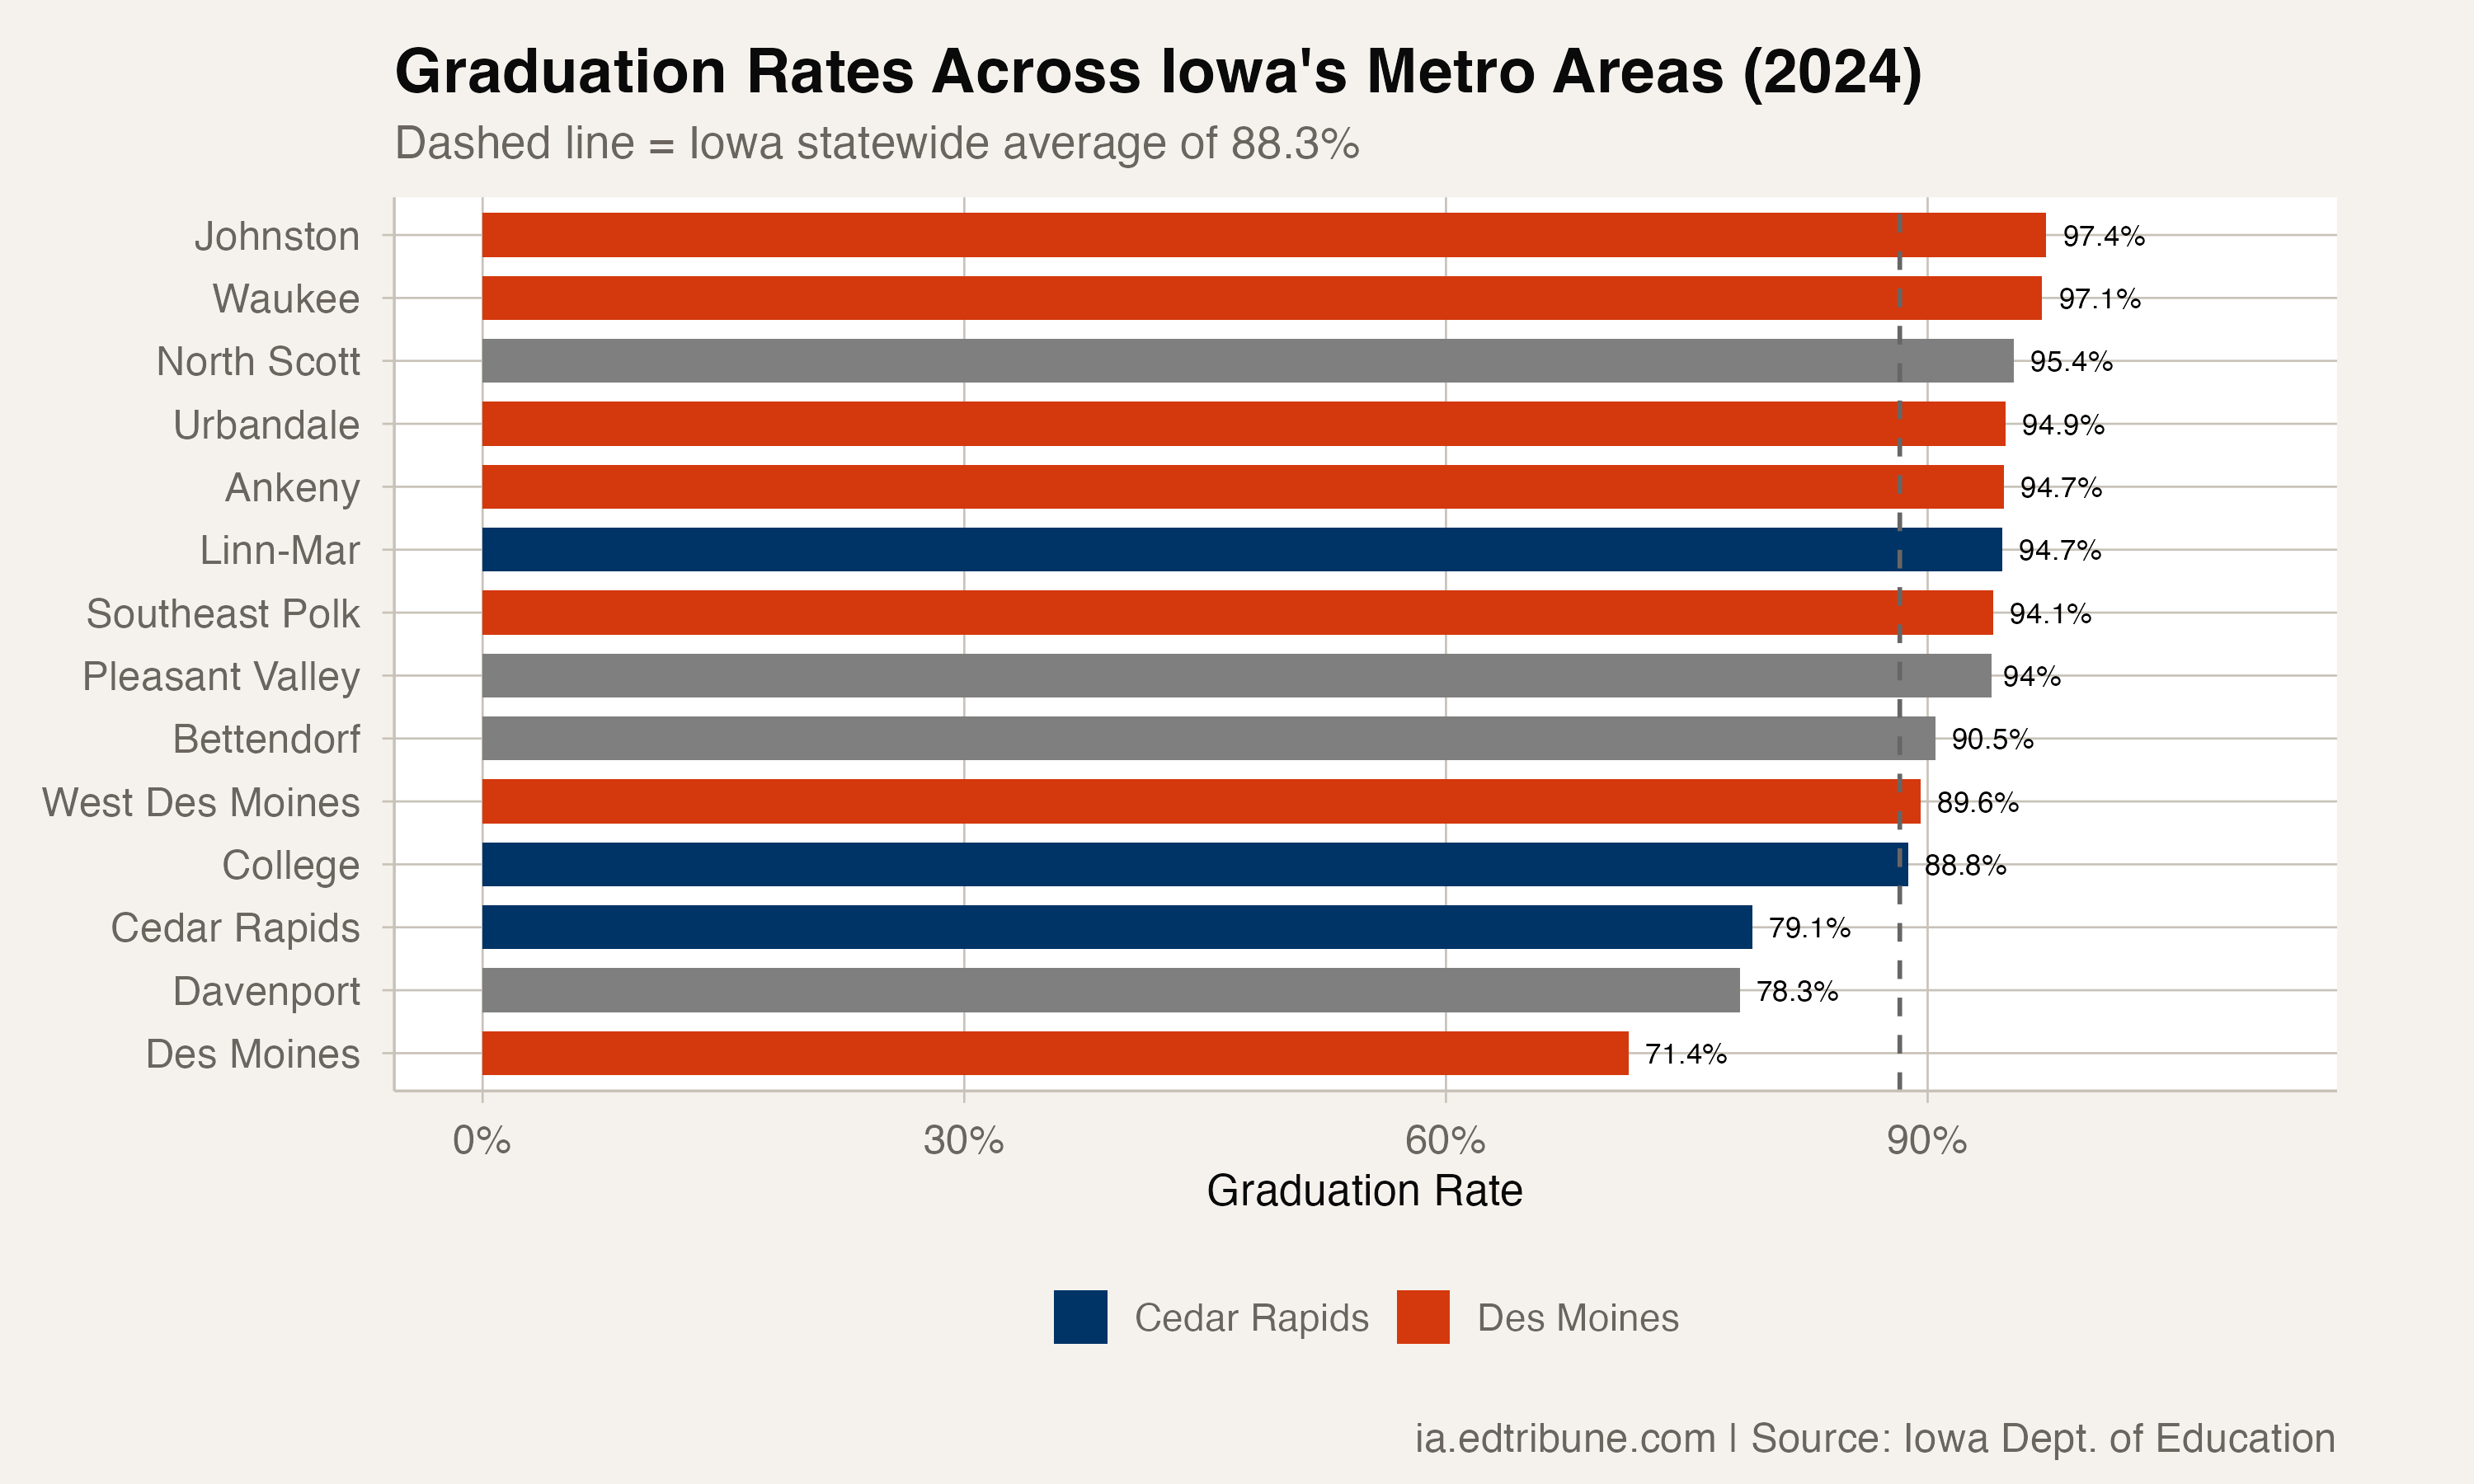
The Des Moines metro is Iowa's starkest example. In 2024, the seven districts serving the metro produced graduation rates spanning 26 points:
| District | Rate | Cohort |
|---|---|---|
| Johnston↗ET | 97.4% | 575 |
| Waukee | 97.1% | 908 |
| Urbandale | 94.9% | 331 |
| Ankeny↗ET | 94.7% | 893 |
| Southeast Polk | 94.1% | 625 |
| West Des Moines | 89.6% | 737 |
| Des Moines↗ET | 71.4% | 2,369 |
The capital city concentrates the metro's poverty, immigrant population, and English learners while the suburbs serve more affluent, more white, and more stable communities.
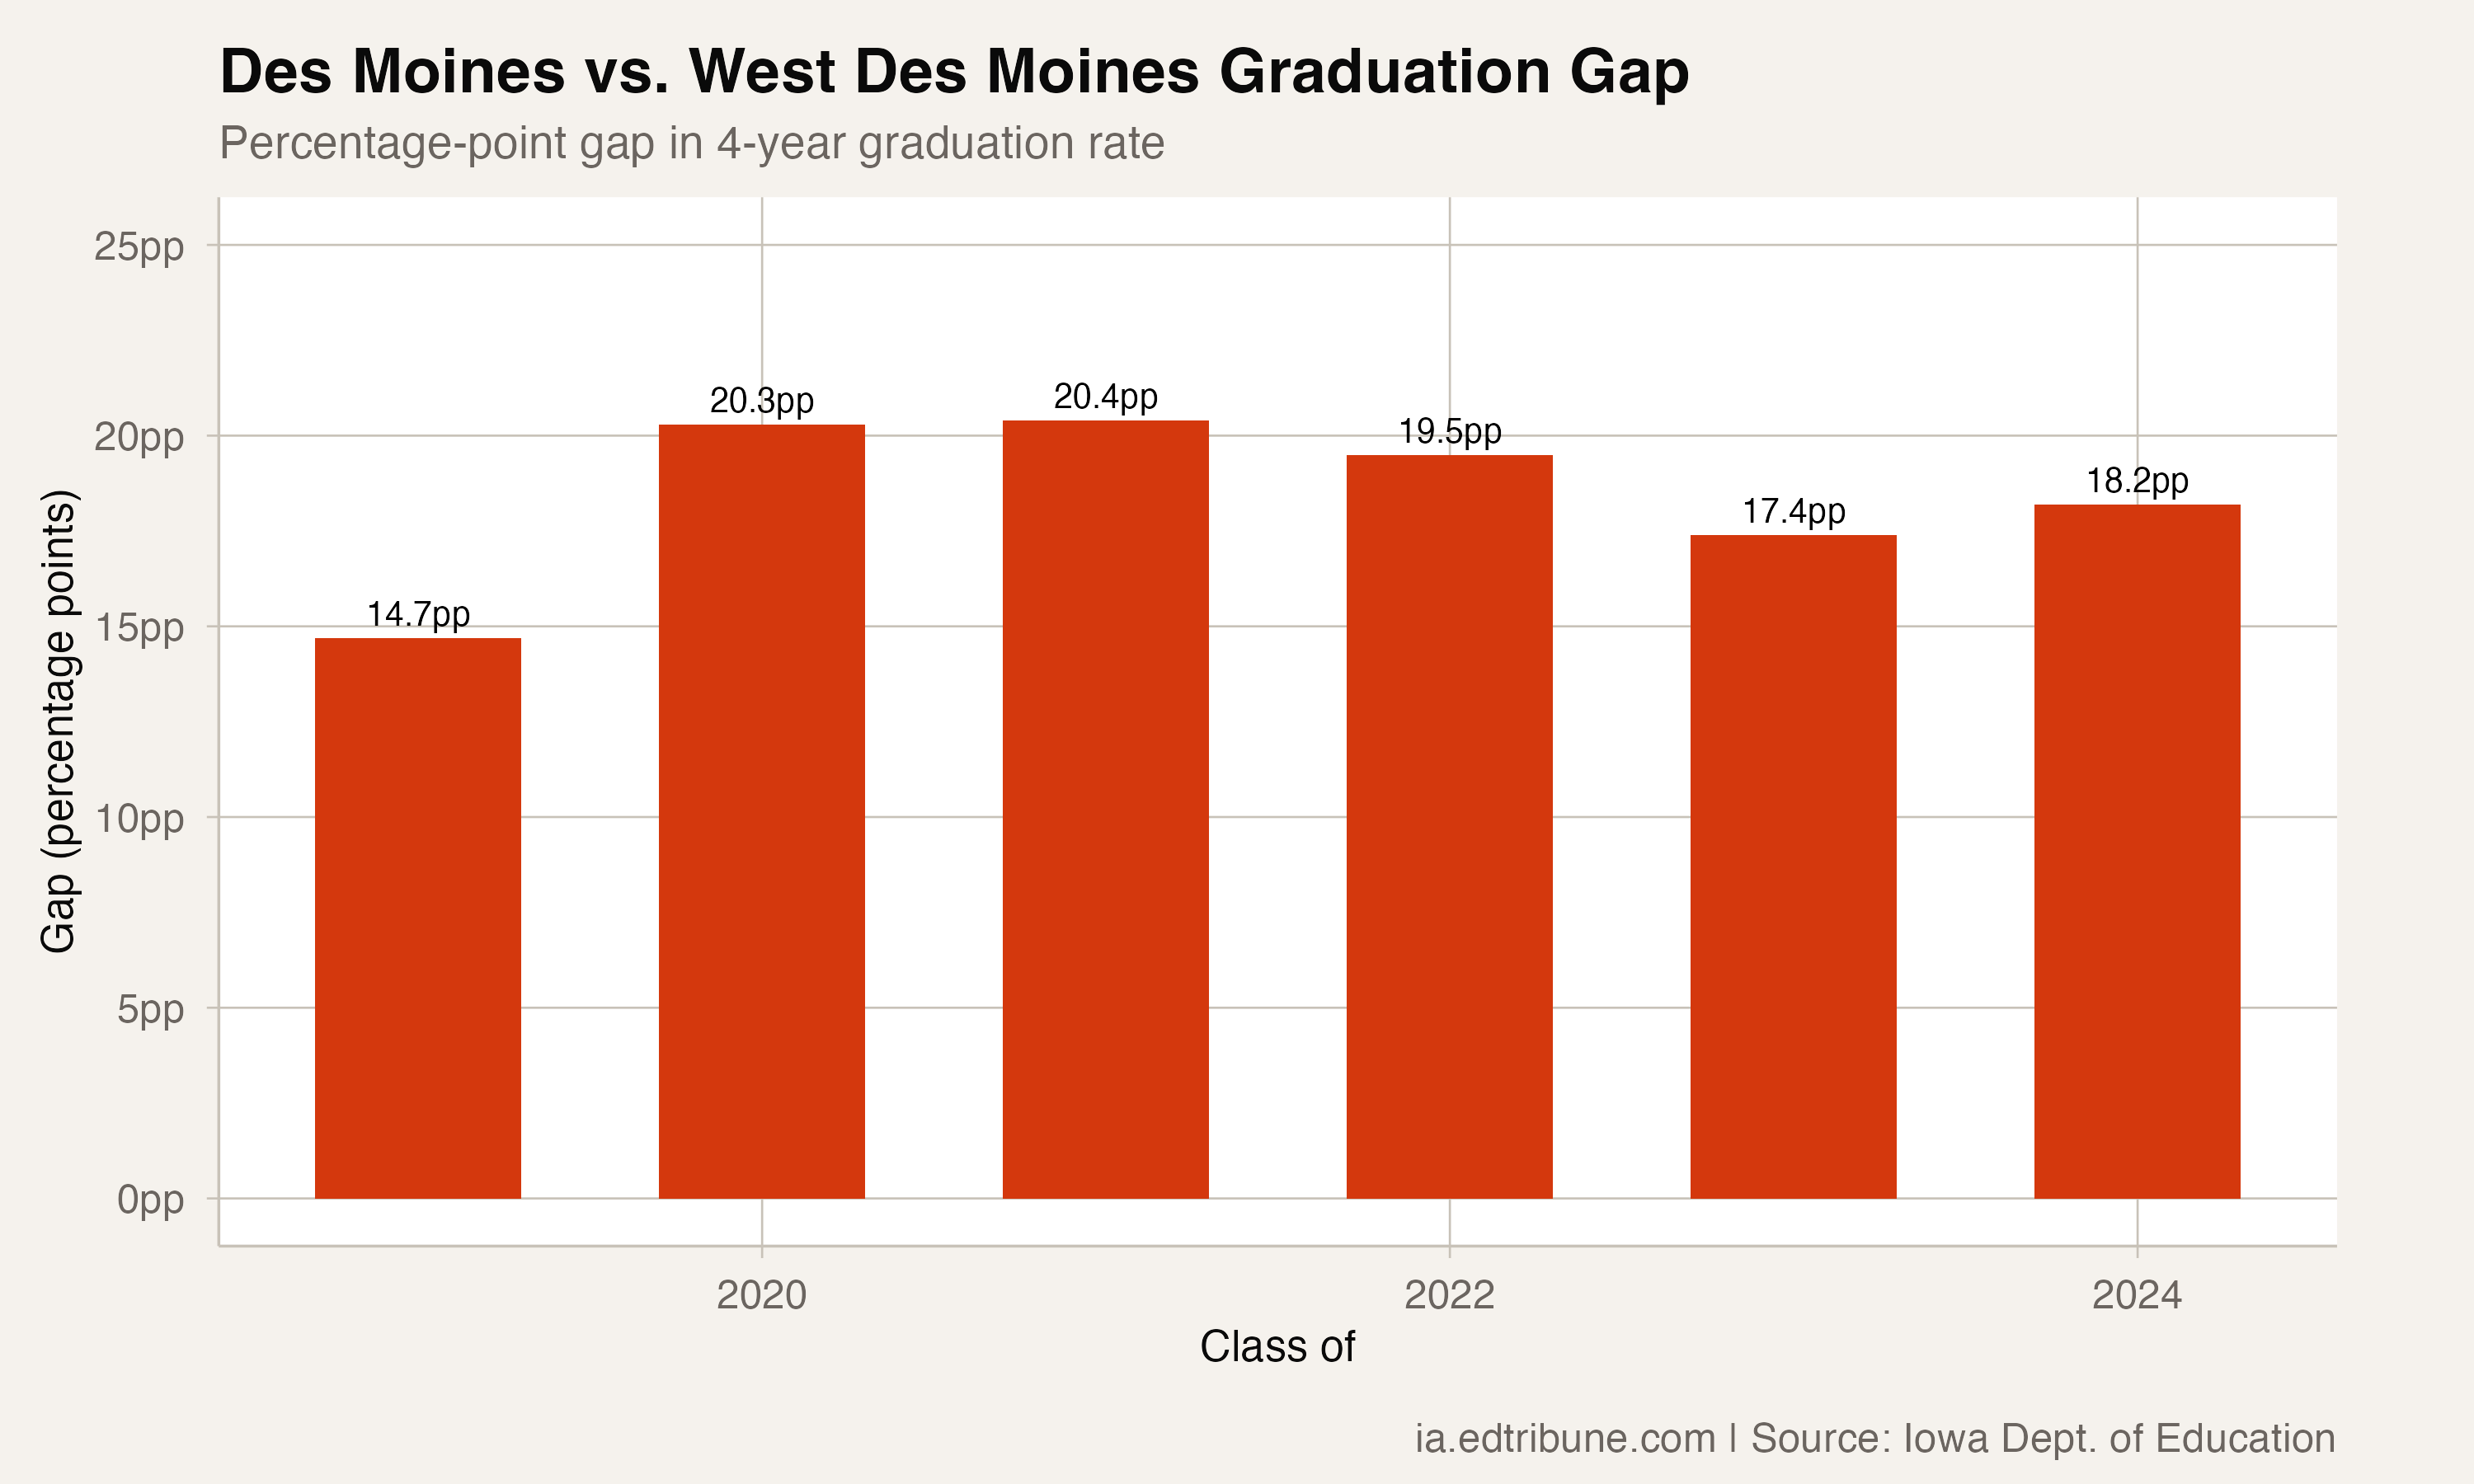
The gap between Des Moines and West Des Moines has hovered between 15 and 20 points for six years. It was 15 points in 2019. It peaked at 20 points in 2020-2021 during the pandemic. It stands at 18 points today -- wider than where it started.
Cedar Rapids: 16 points
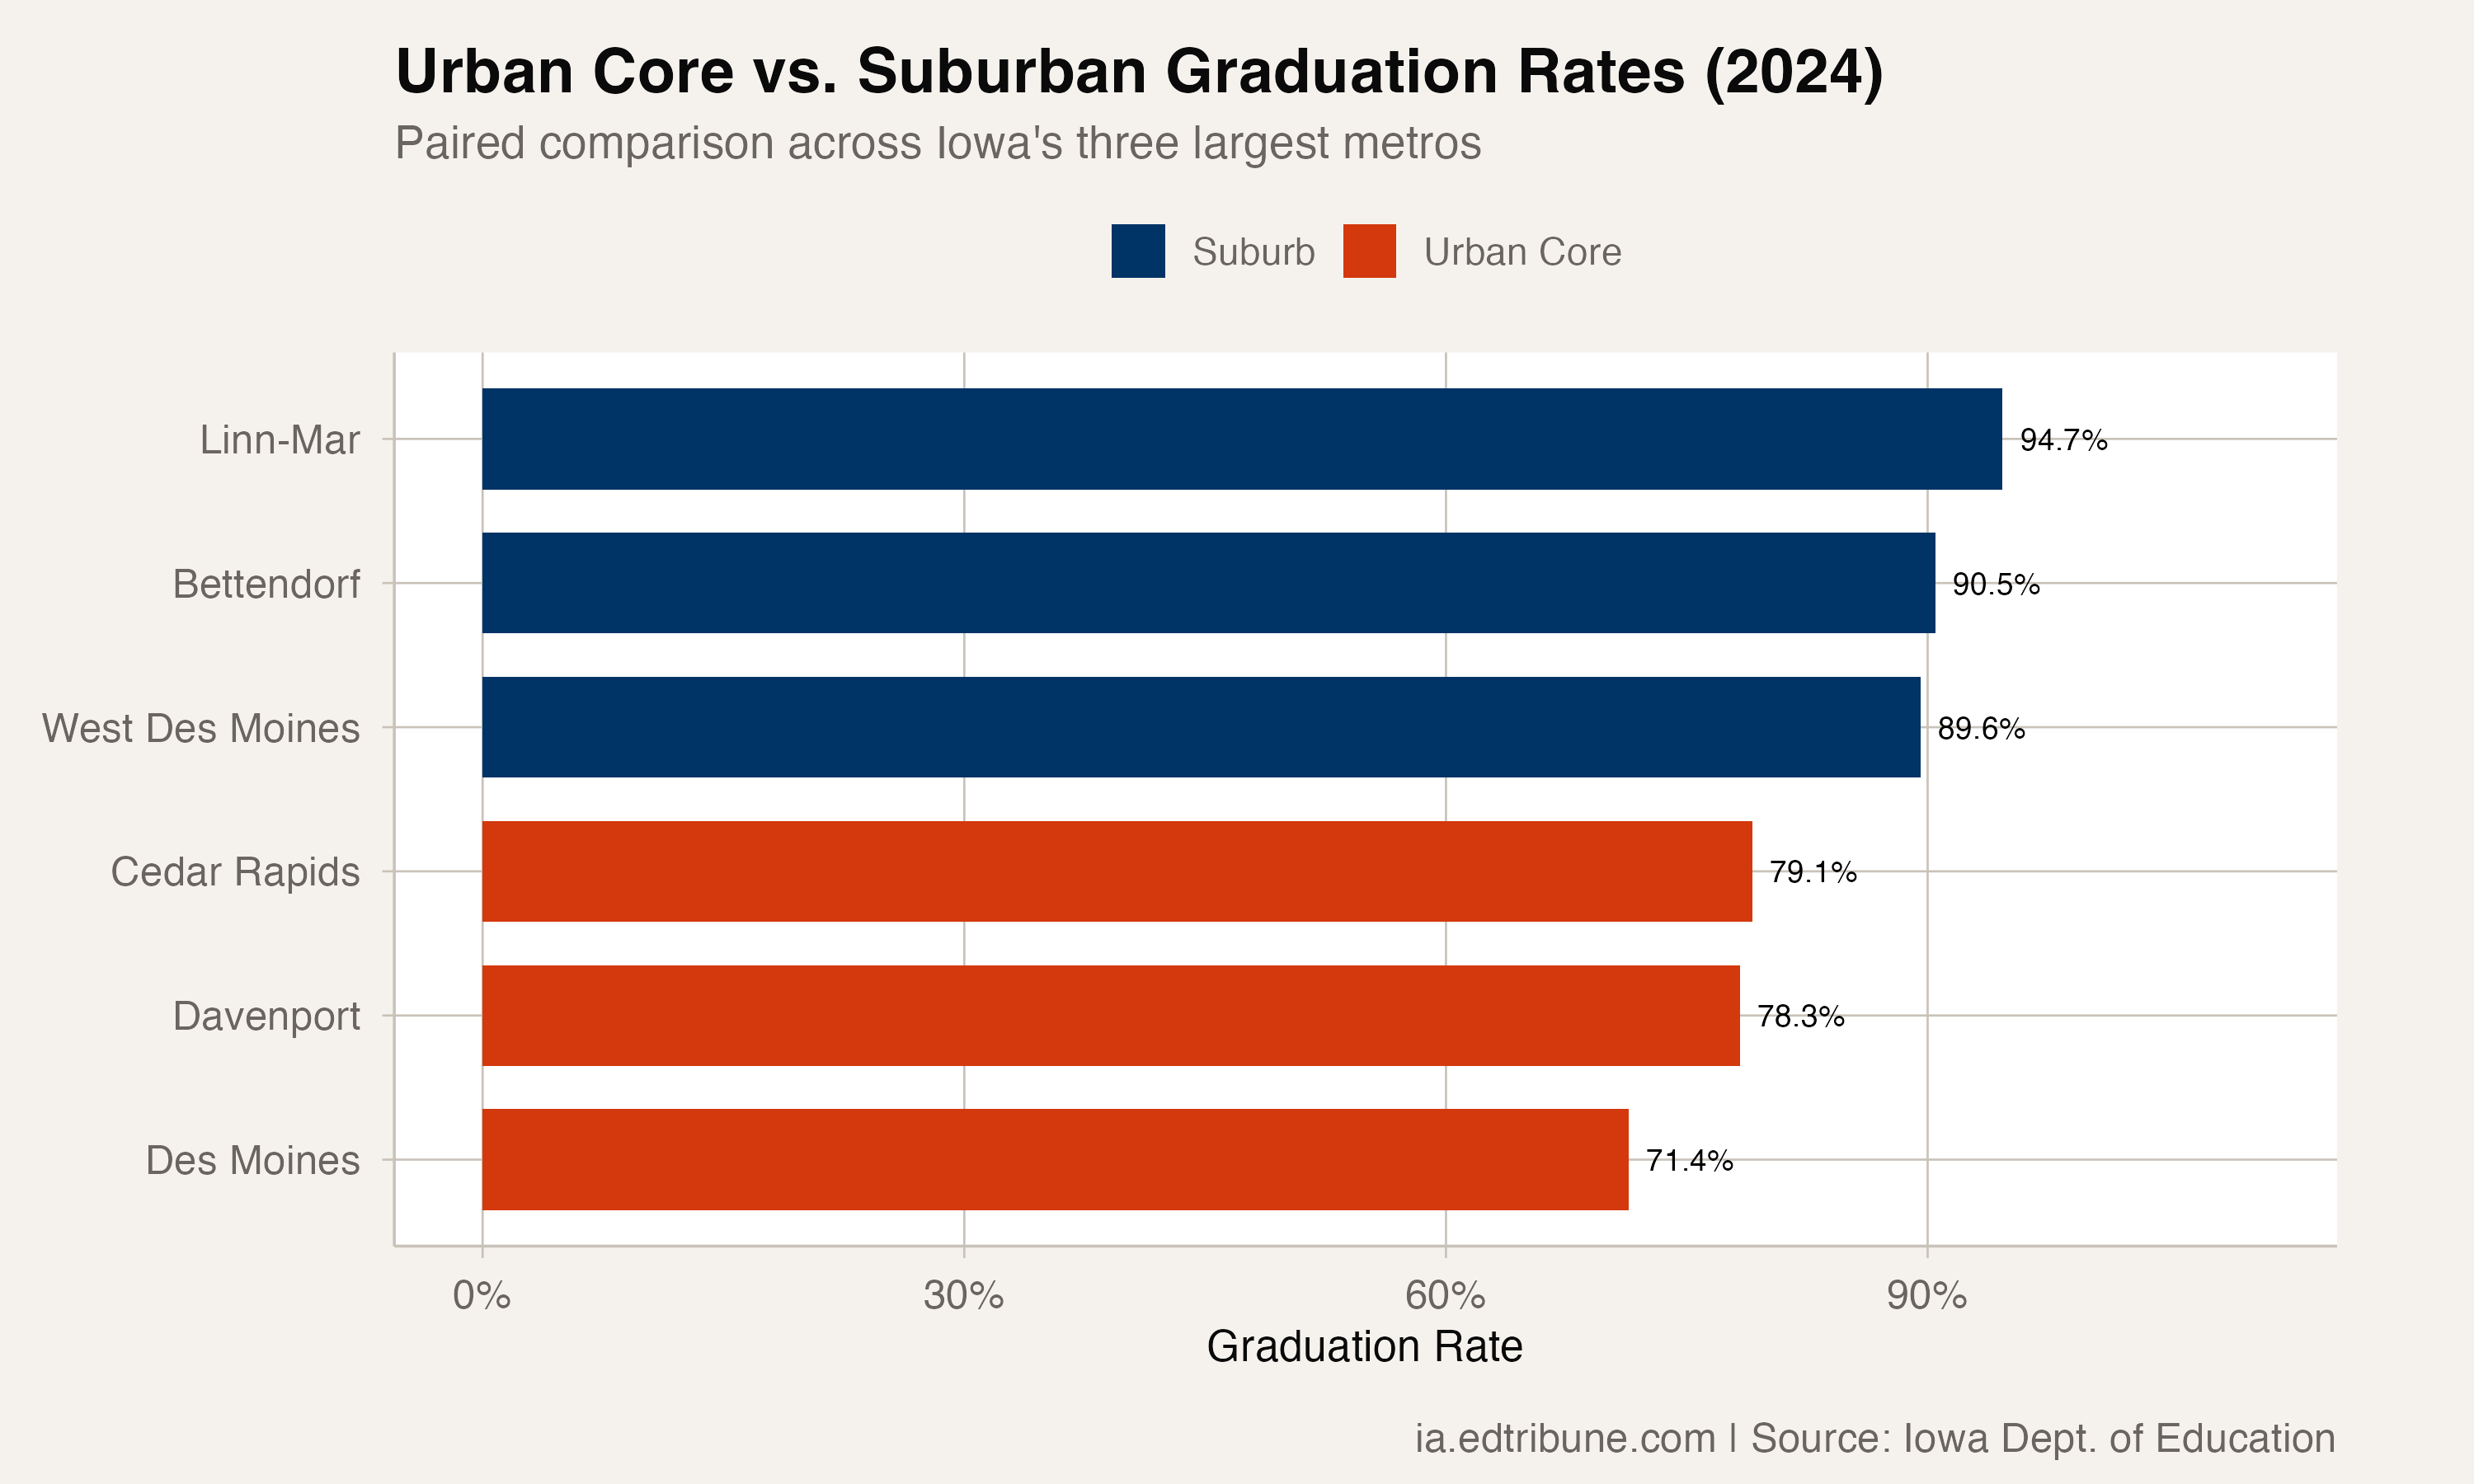
Cedar Rapids↗ET, Iowa's second-largest city, graduated 79% of students in 2024. Its suburban neighbor Linn-Mar↗ET graduated 95%. Cedar Falls, though technically part of the Waterloo metro, graduated 96%.
The College Community School District, which straddles Cedar Rapids' southern boundary, graduated 89% -- illustrating how suburban districts can serve parts of the same city at substantially higher rates.
Quad Cities: 17 points
Davenport↗ET graduated 78% of students. Across the suburban boundary, Bettendorf↗ET graduated 90%. North Scott, further from the urban core, graduated 95%. Pleasant Valley graduated 94%.
The 17-point gap between Davenport and North Scott follows the same pattern as the Des Moines and Cedar Rapids metros: an urban core district serving a diverse, lower-income student body adjacent to suburbs where nine in ten students graduate on time.
The pattern across all cities
Iowa's eight largest urban districts graduated at rates ranging from 71% (Des Moines) to 91% (Iowa City). Only Iowa City exceeded the state average of 88%.
Iowa City's high rate reflects the unusual demographics of a university town. Sioux City, despite a heavily immigrant student body, graduated 86% -- a notable outlier among Iowa's urban districts.
Waterloo↗ET sits at 74%, Dubuque↗ET at 82%, and Council Bluffs at 84%. In each case, adjacent suburban districts graduate at rates 10 to 20 points higher.
What geography measures
The suburban-urban graduation gap is a proxy for a constellation of factors that sort by geography: family income, parental education, English proficiency, housing stability, school funding, and teacher experience. Iowa's metro areas are small enough that these factors change dramatically across a single district boundary.
A student who lives in Des Moines and a student who lives in Waukee may attend middle schools separated by four miles. Their probability of graduating on time differs by 26 percentage points. Iowa's graduation data does not explain why. But it measures the distance precisely, and six years of data show no sign of the gap closing.
Detailed code that reproduces the analysis and figures in this article is available exclusively to EdTribune subscribers.
Discussion
Sign in to join the discussion.
Loading comments...