In this series: Iowa 2025-26 Enrollment.
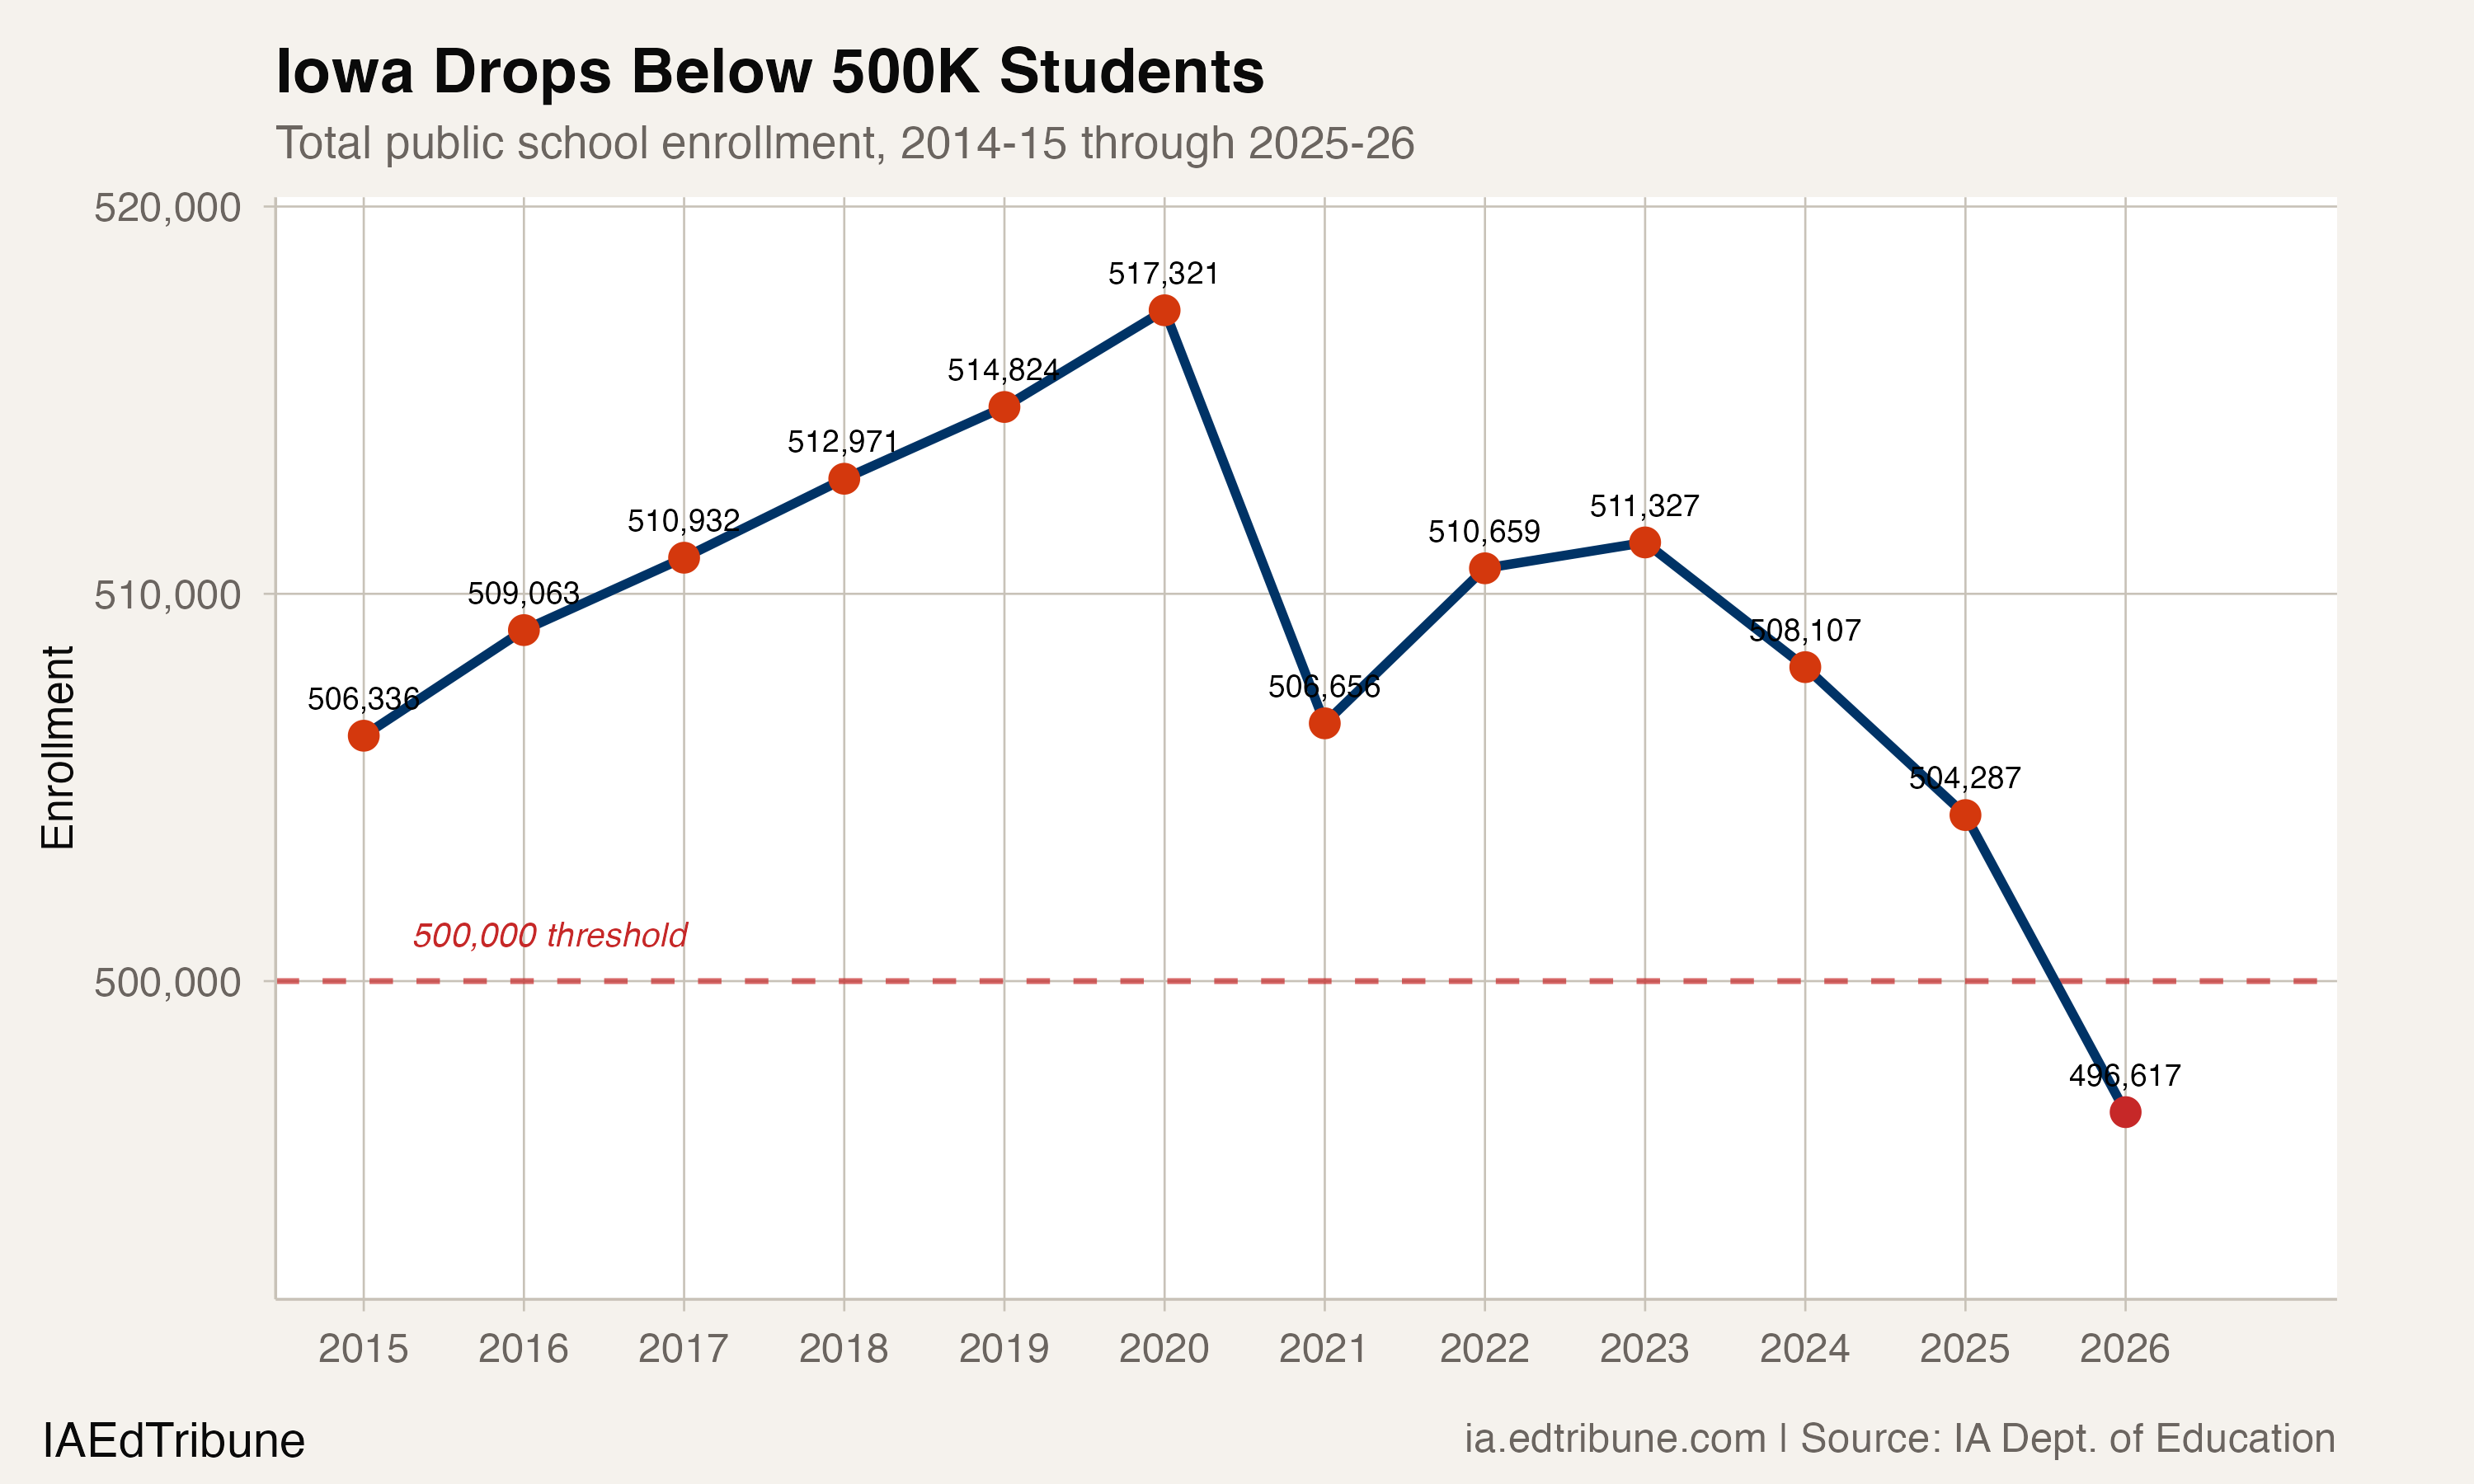
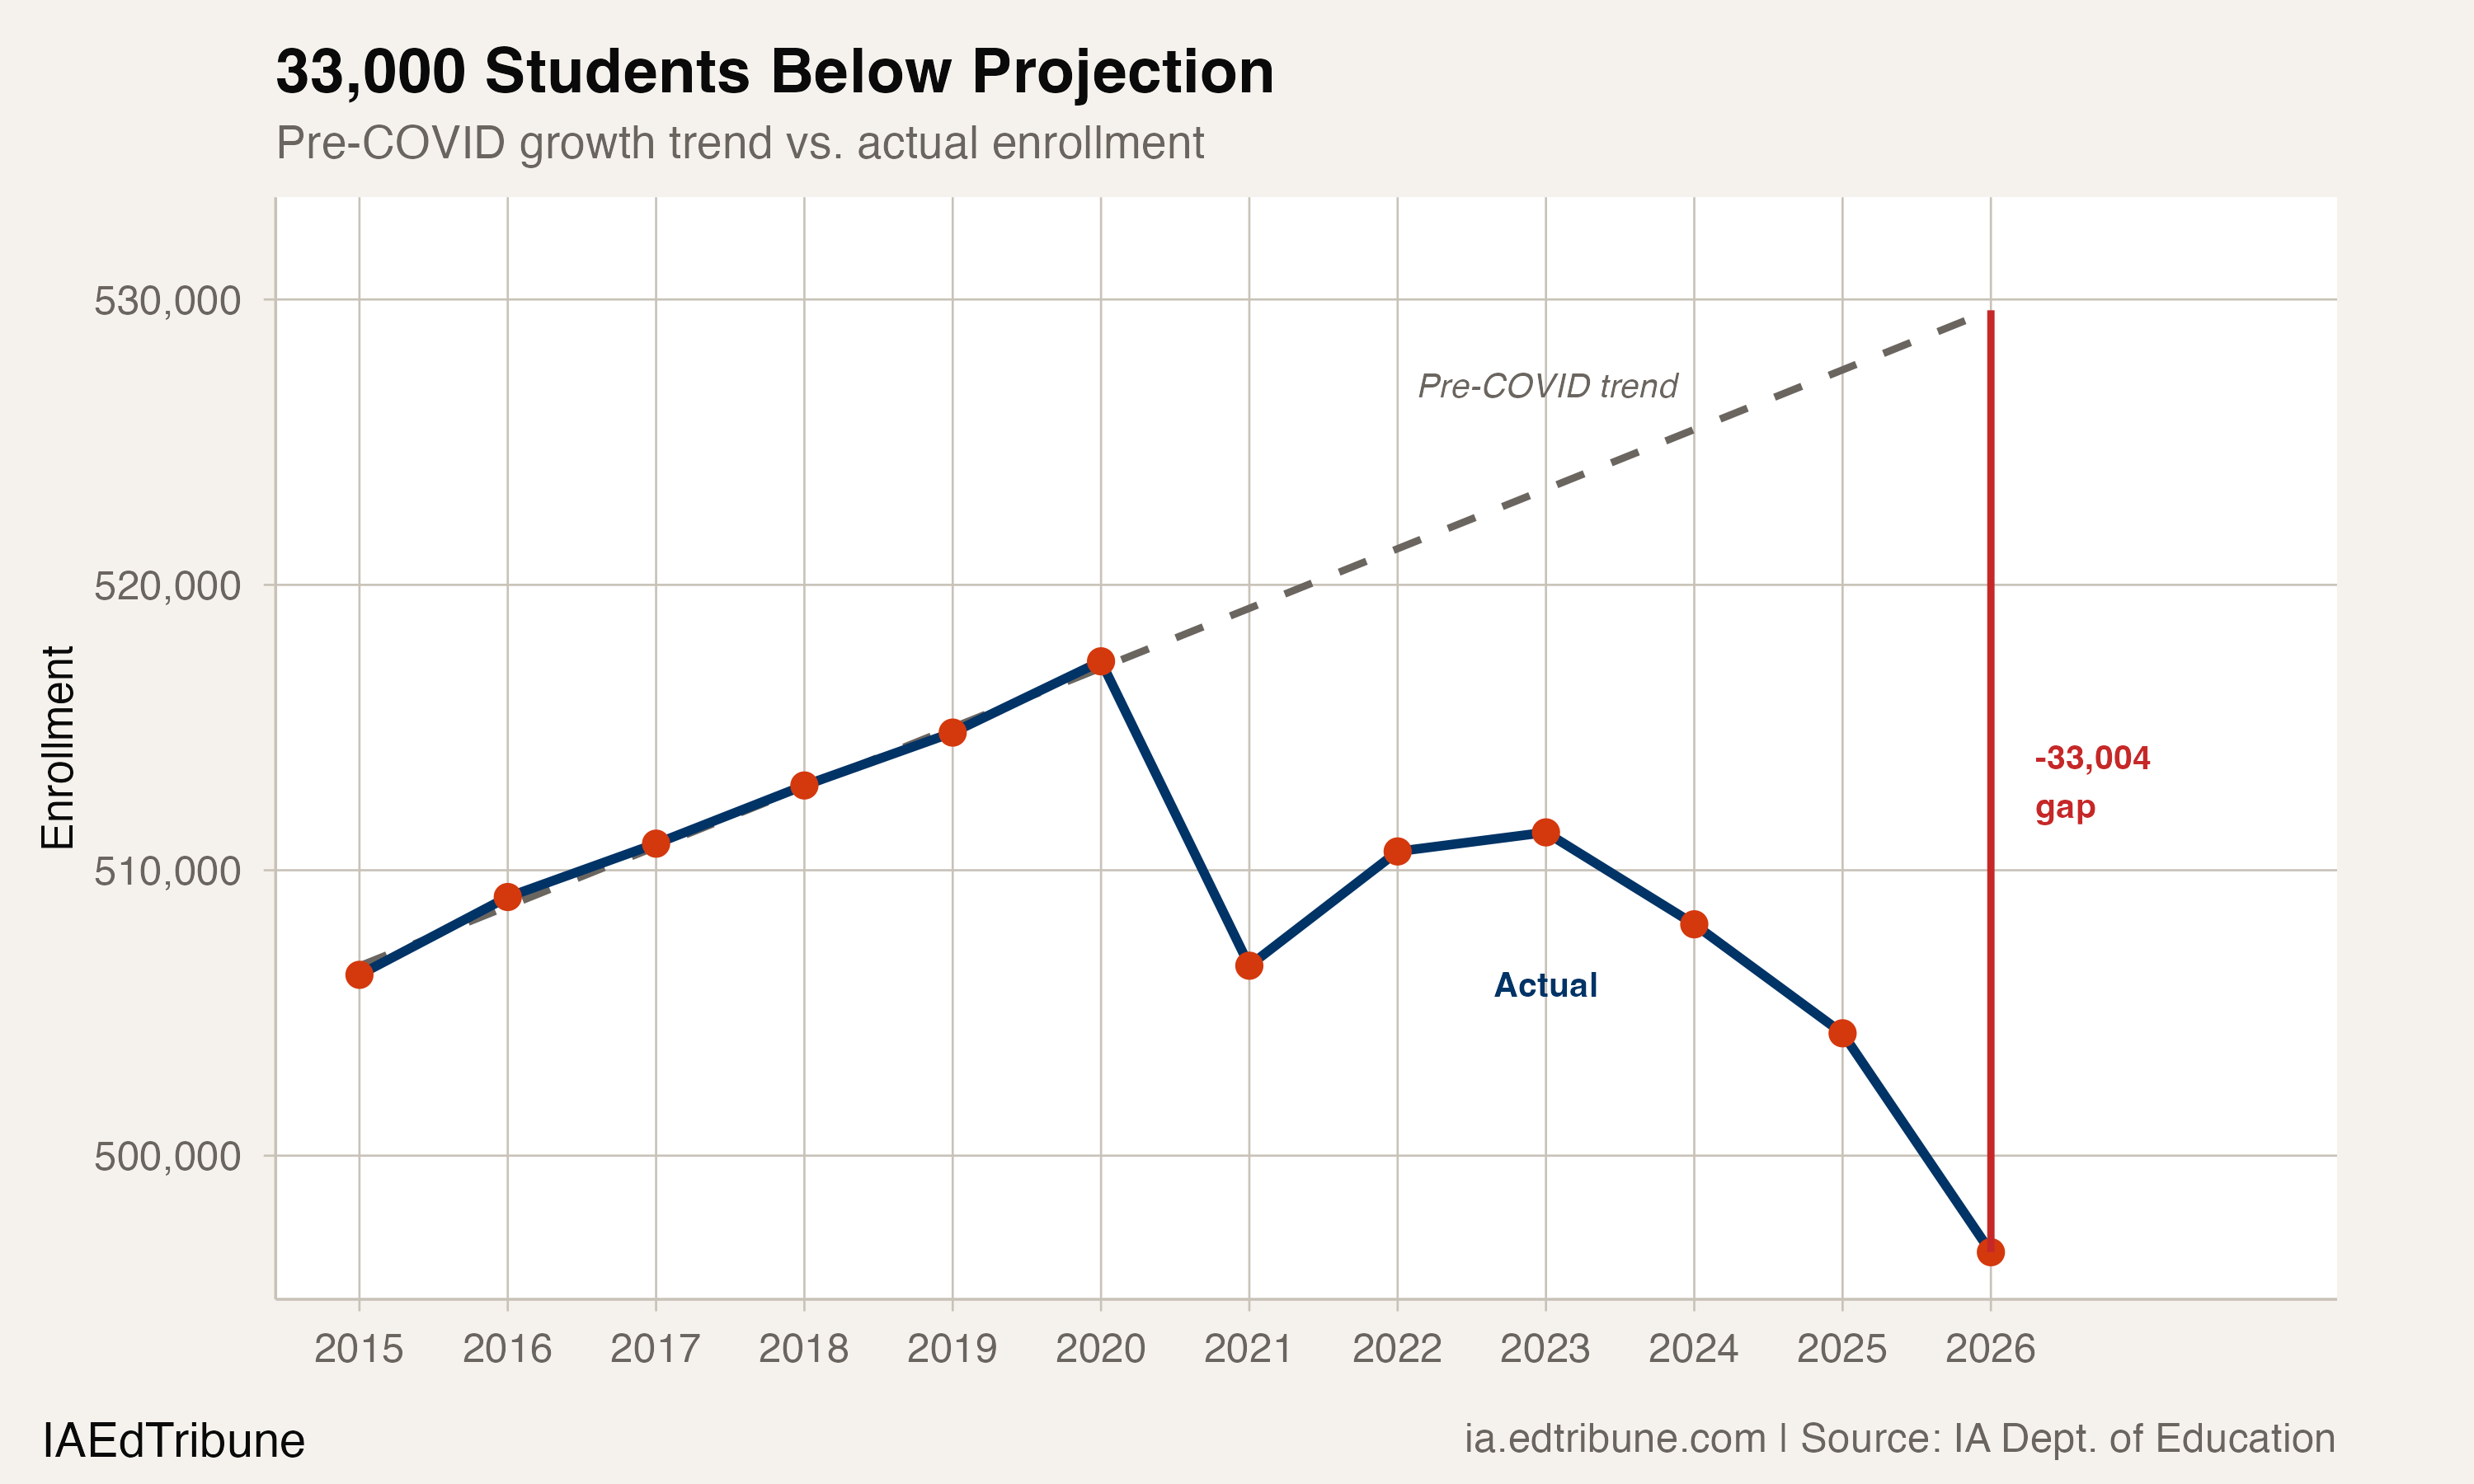
Iowa's public school system was growing before the pandemic. From 2014-15 through 2019-20, enrollment rose by an average of 2,200 students per year, reaching a peak of 517,321. That trajectory would have put Iowa above 529,000 students by now. Instead, the state enrolled 496,617 in 2025-26, falling below 500,000 for the first time in the data window and landing 33,004 students short of where the pre-pandemic trend pointed.
The 7,670-student drop is the largest single-year loss outside of the COVID-19 disruption, and it is double the prior year's decline. Iowa is no longer coasting downward. It is accelerating.
Three years worse than COVID
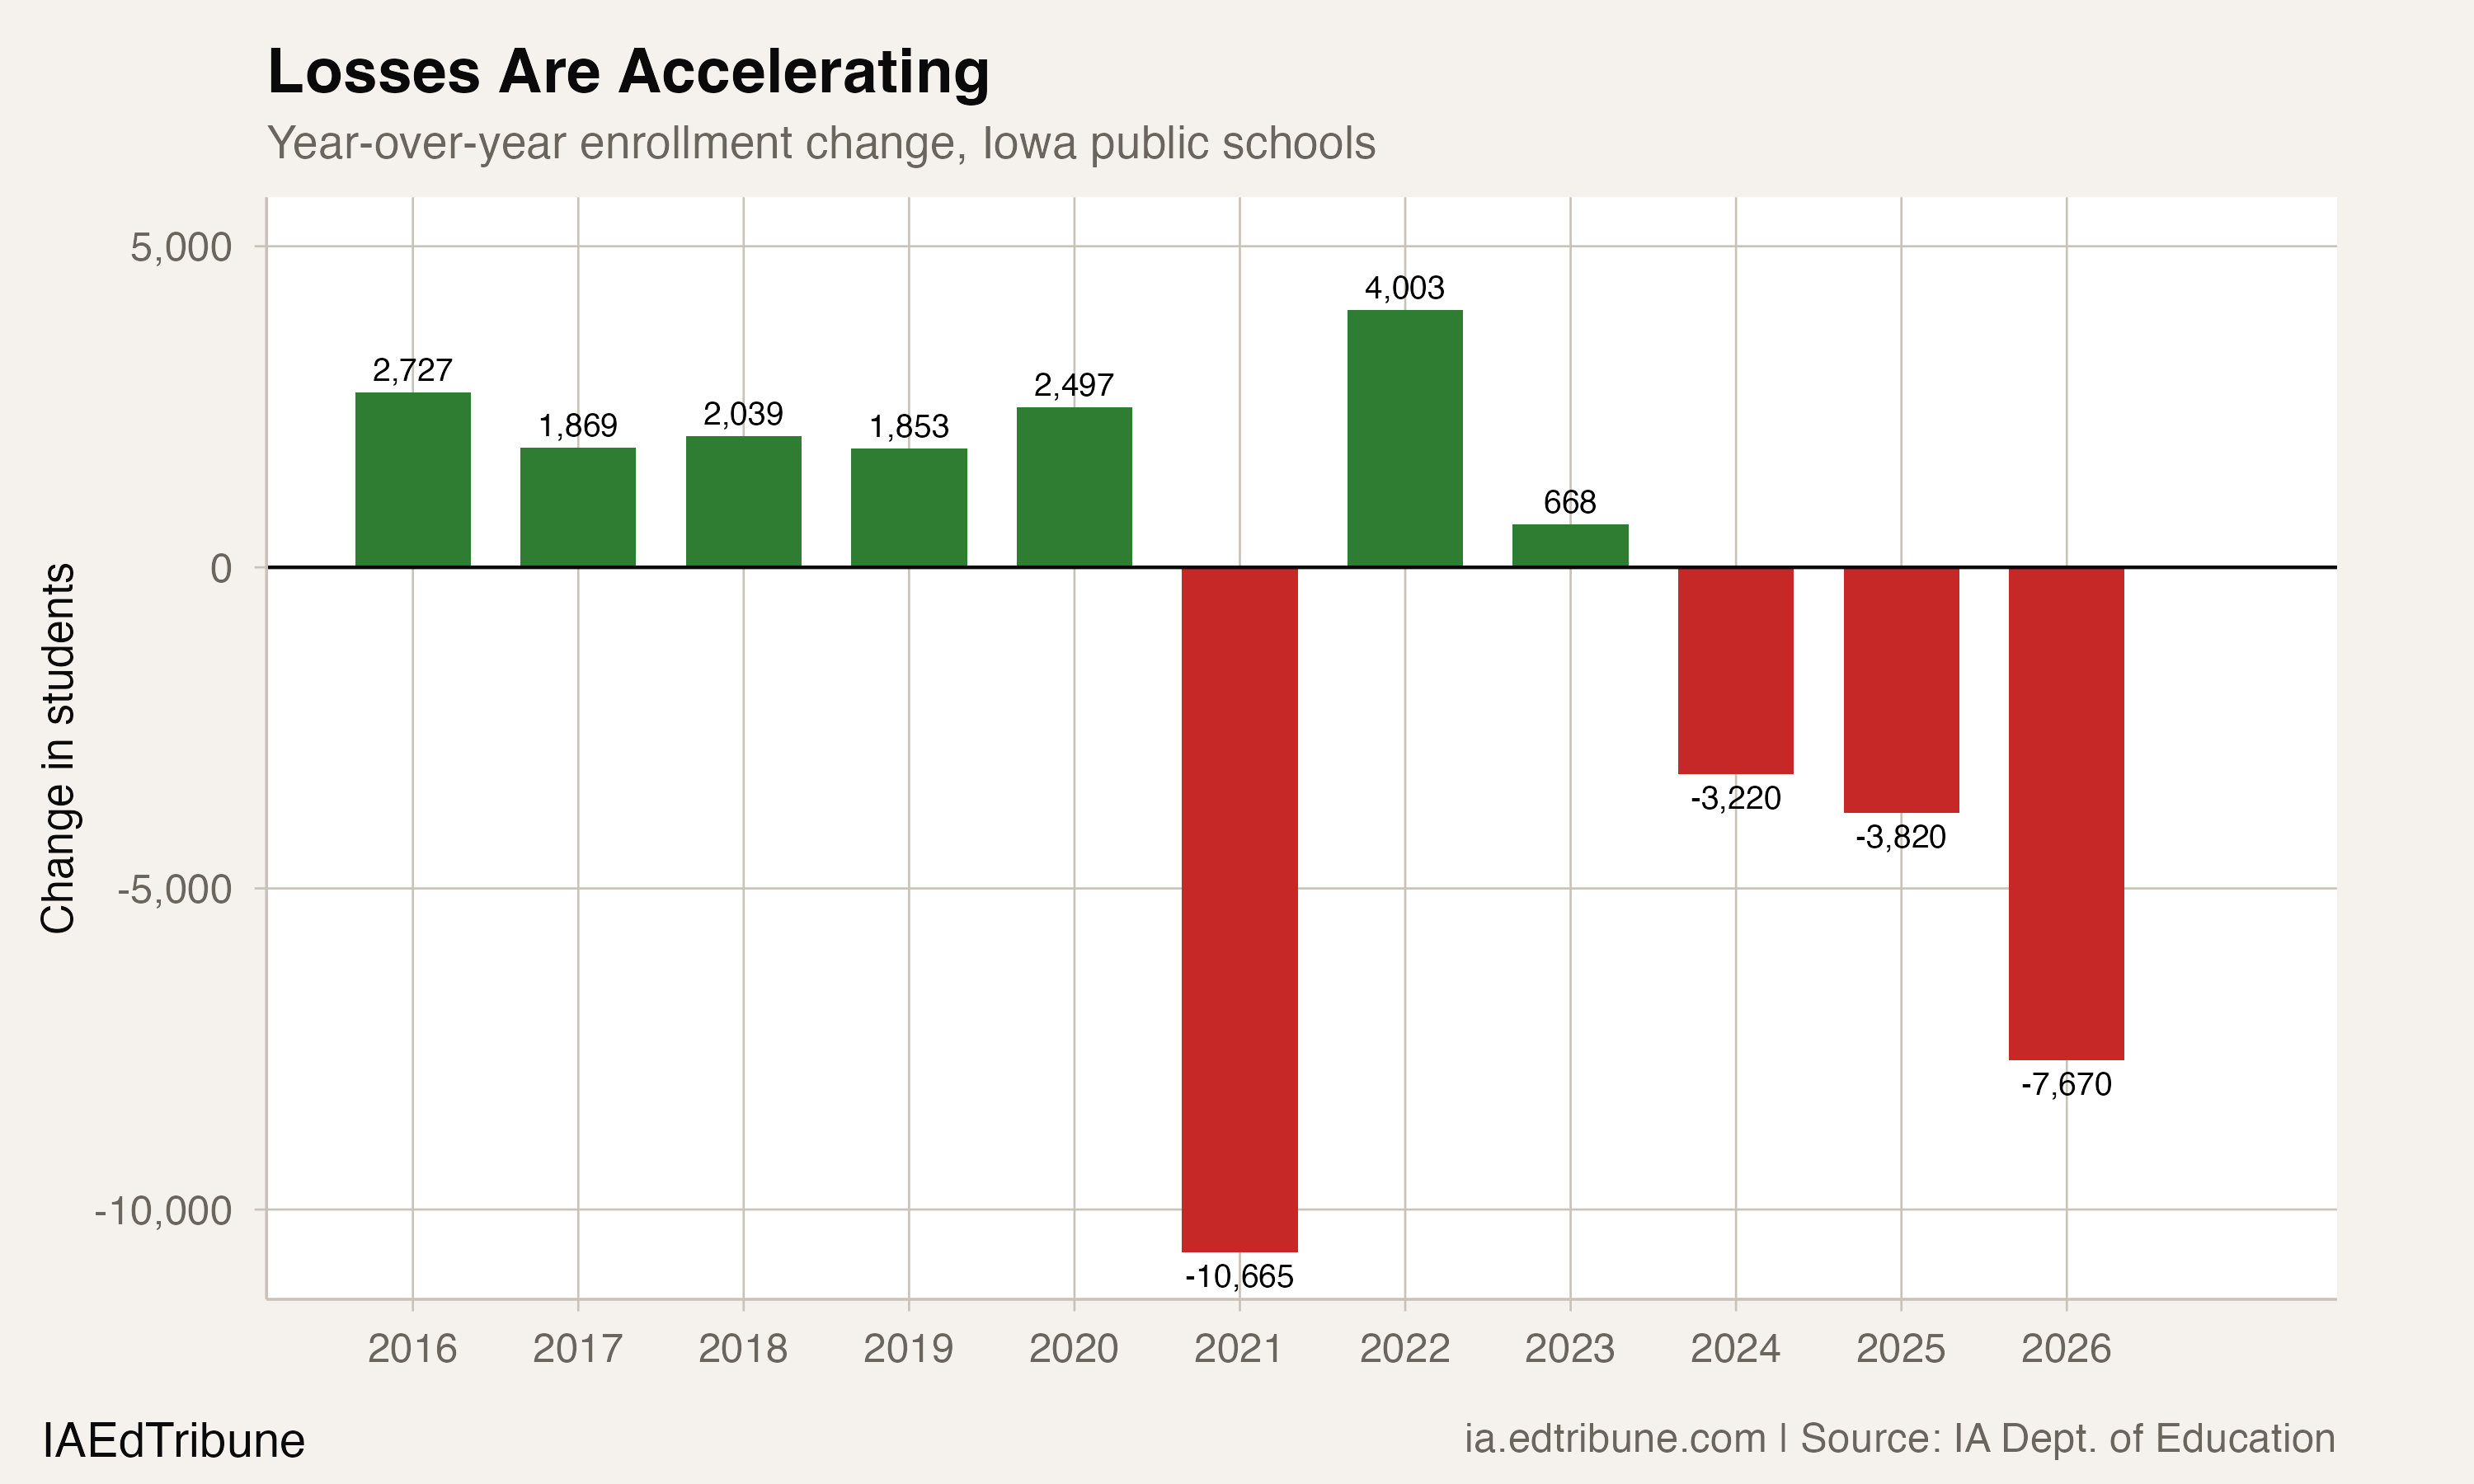
The pandemic erased 10,665 students in a single year. That was treated as a crisis, and schools saw a partial bounce-back of 4,003 students the following year. But the current three-year slide, from 511,327 in 2022-23 to 496,617 in 2025-26, totals 14,710 students. That exceeds the COVID single-year crash by 38%.
The difference is speed. COVID hit all at once and partially reversed. The current decline is compounding: -3,220 in 2023-24, -3,820 in 2024-25, -7,670 in 2025-26. Each year is worse than the last.
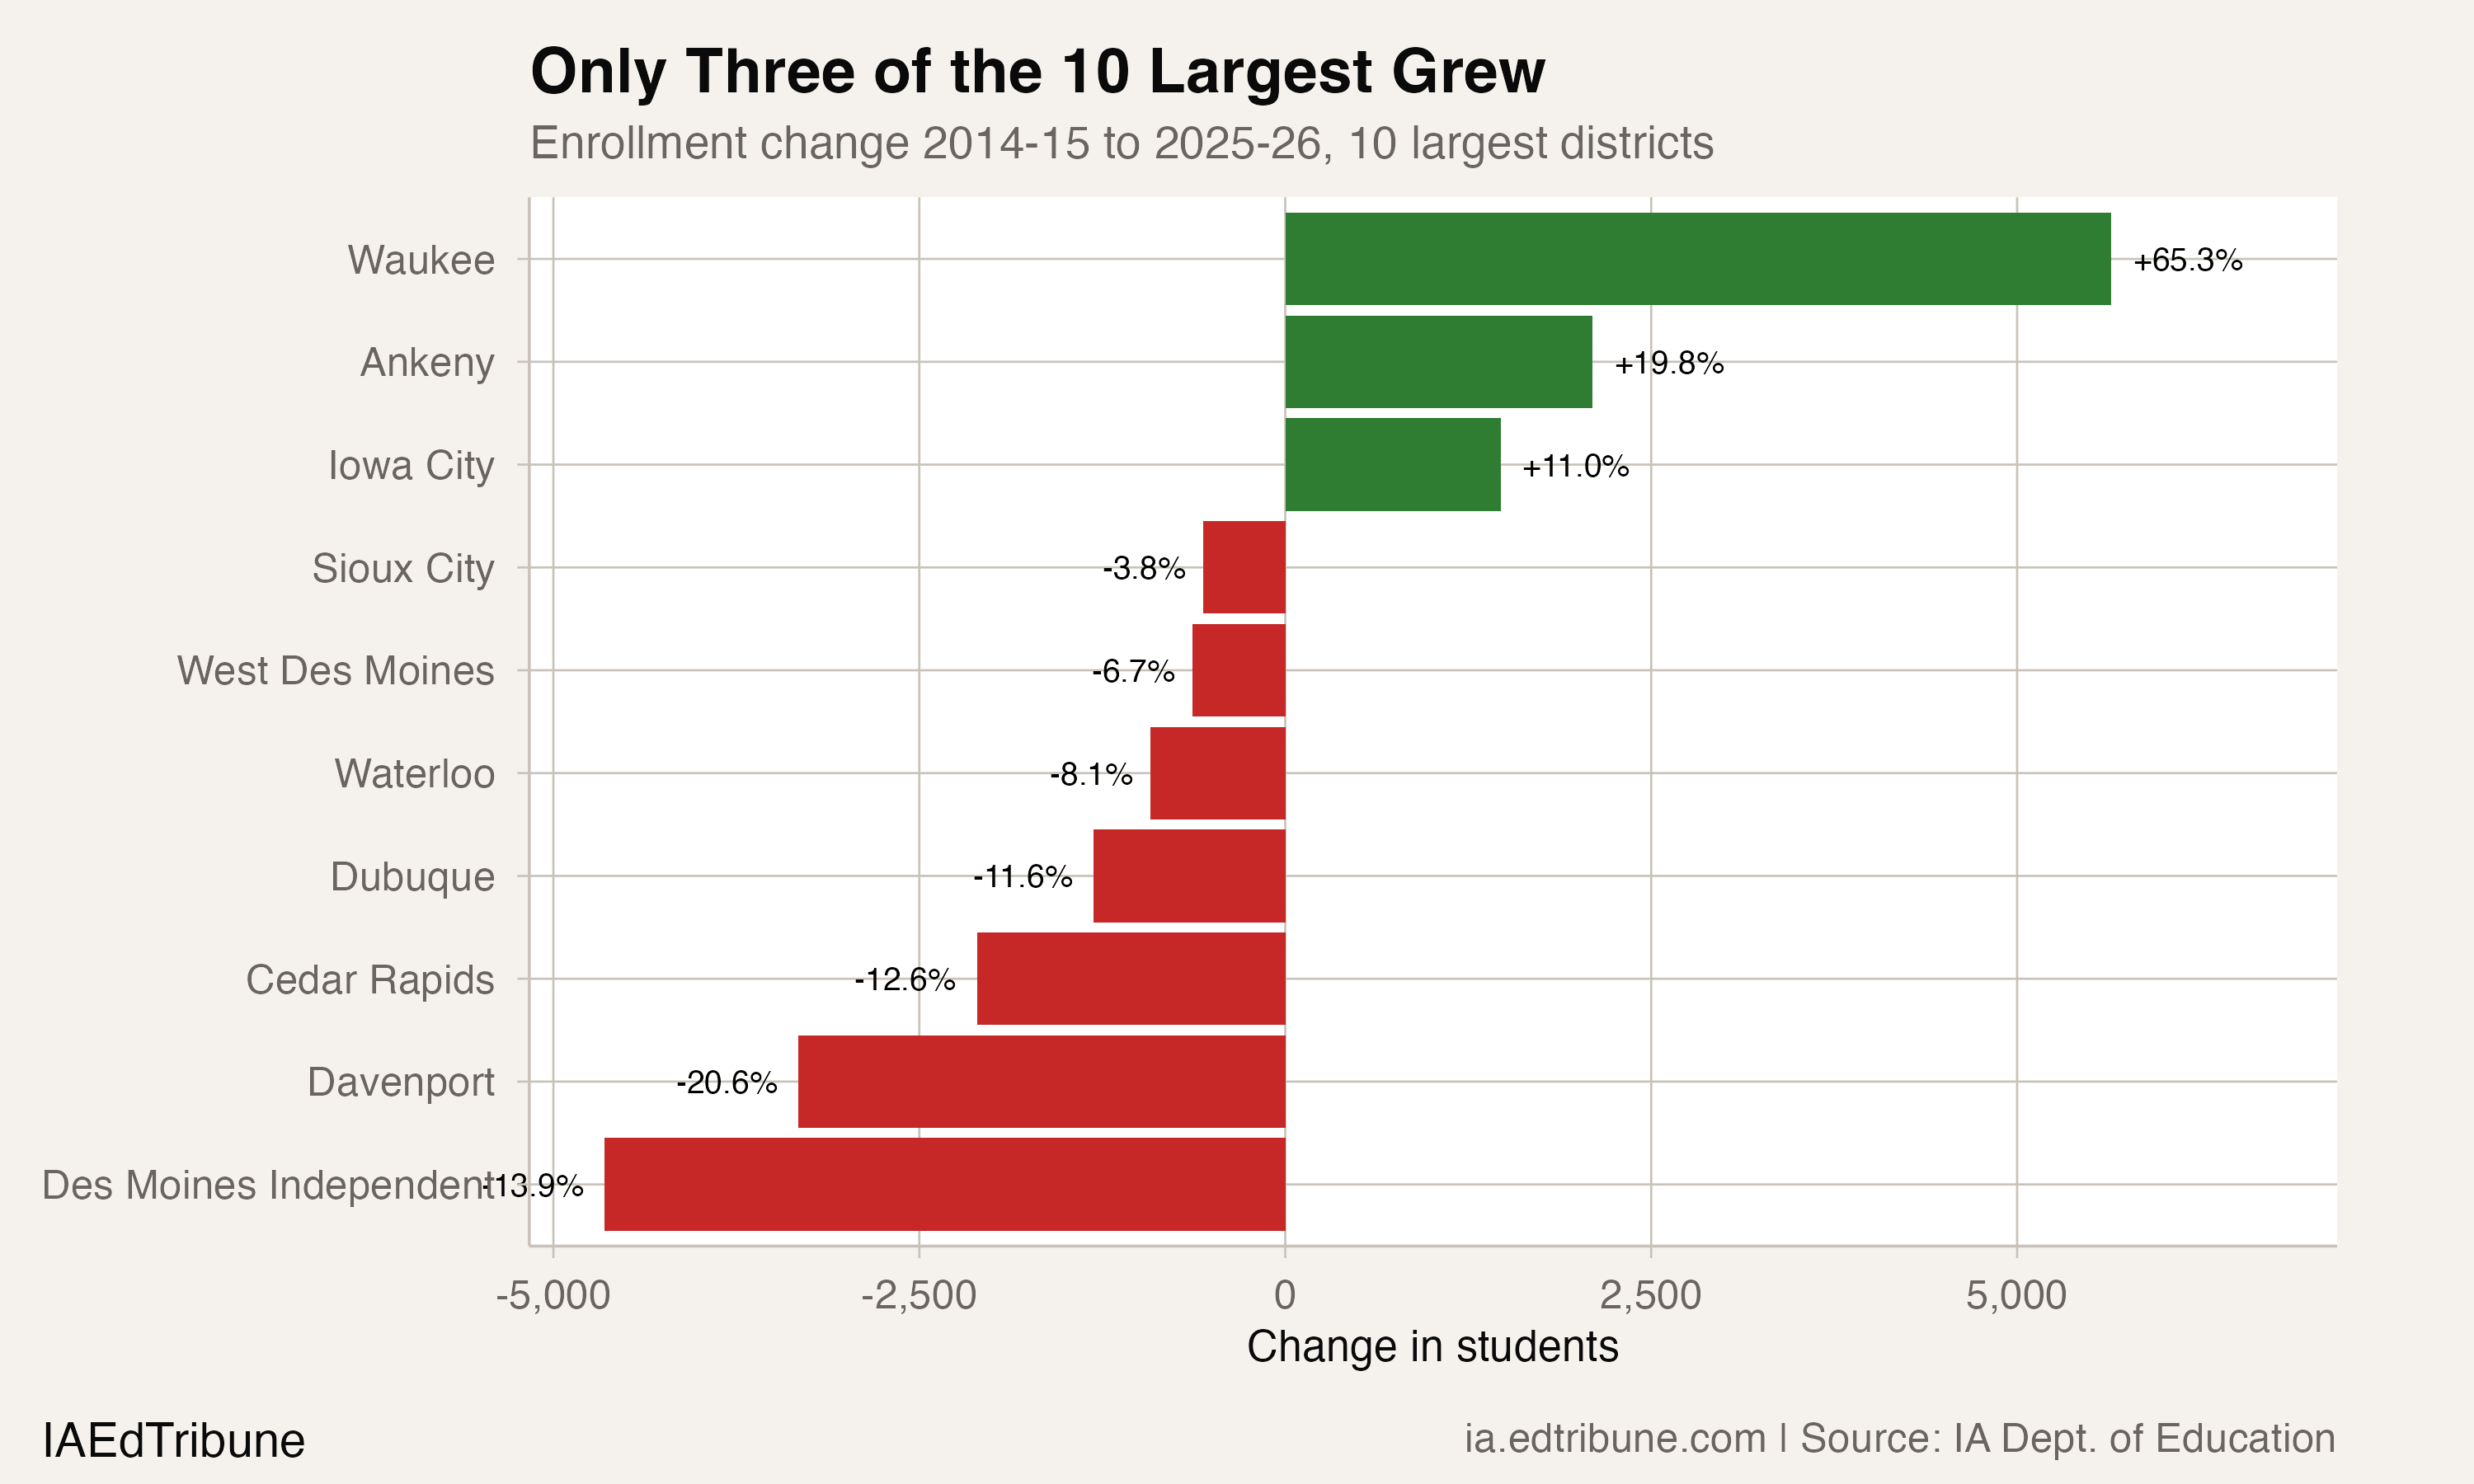
Of Iowa's 325 districts with at least five years of data, 128 are at their all-time low enrollment in 2025-26, roughly 39%. Only 24 are at their all-time high. Among the 10 largest districts, only three grew over the 11-year window: Waukee (+65.3%), Ankeny (+19.8%), and Iowa City (+11.0%). The other seven, including Des Moines (-13.9%), Cedar Rapids (-12.6%), and Davenport (-20.6%), are smaller than they were a decade ago.
The kindergarten signal
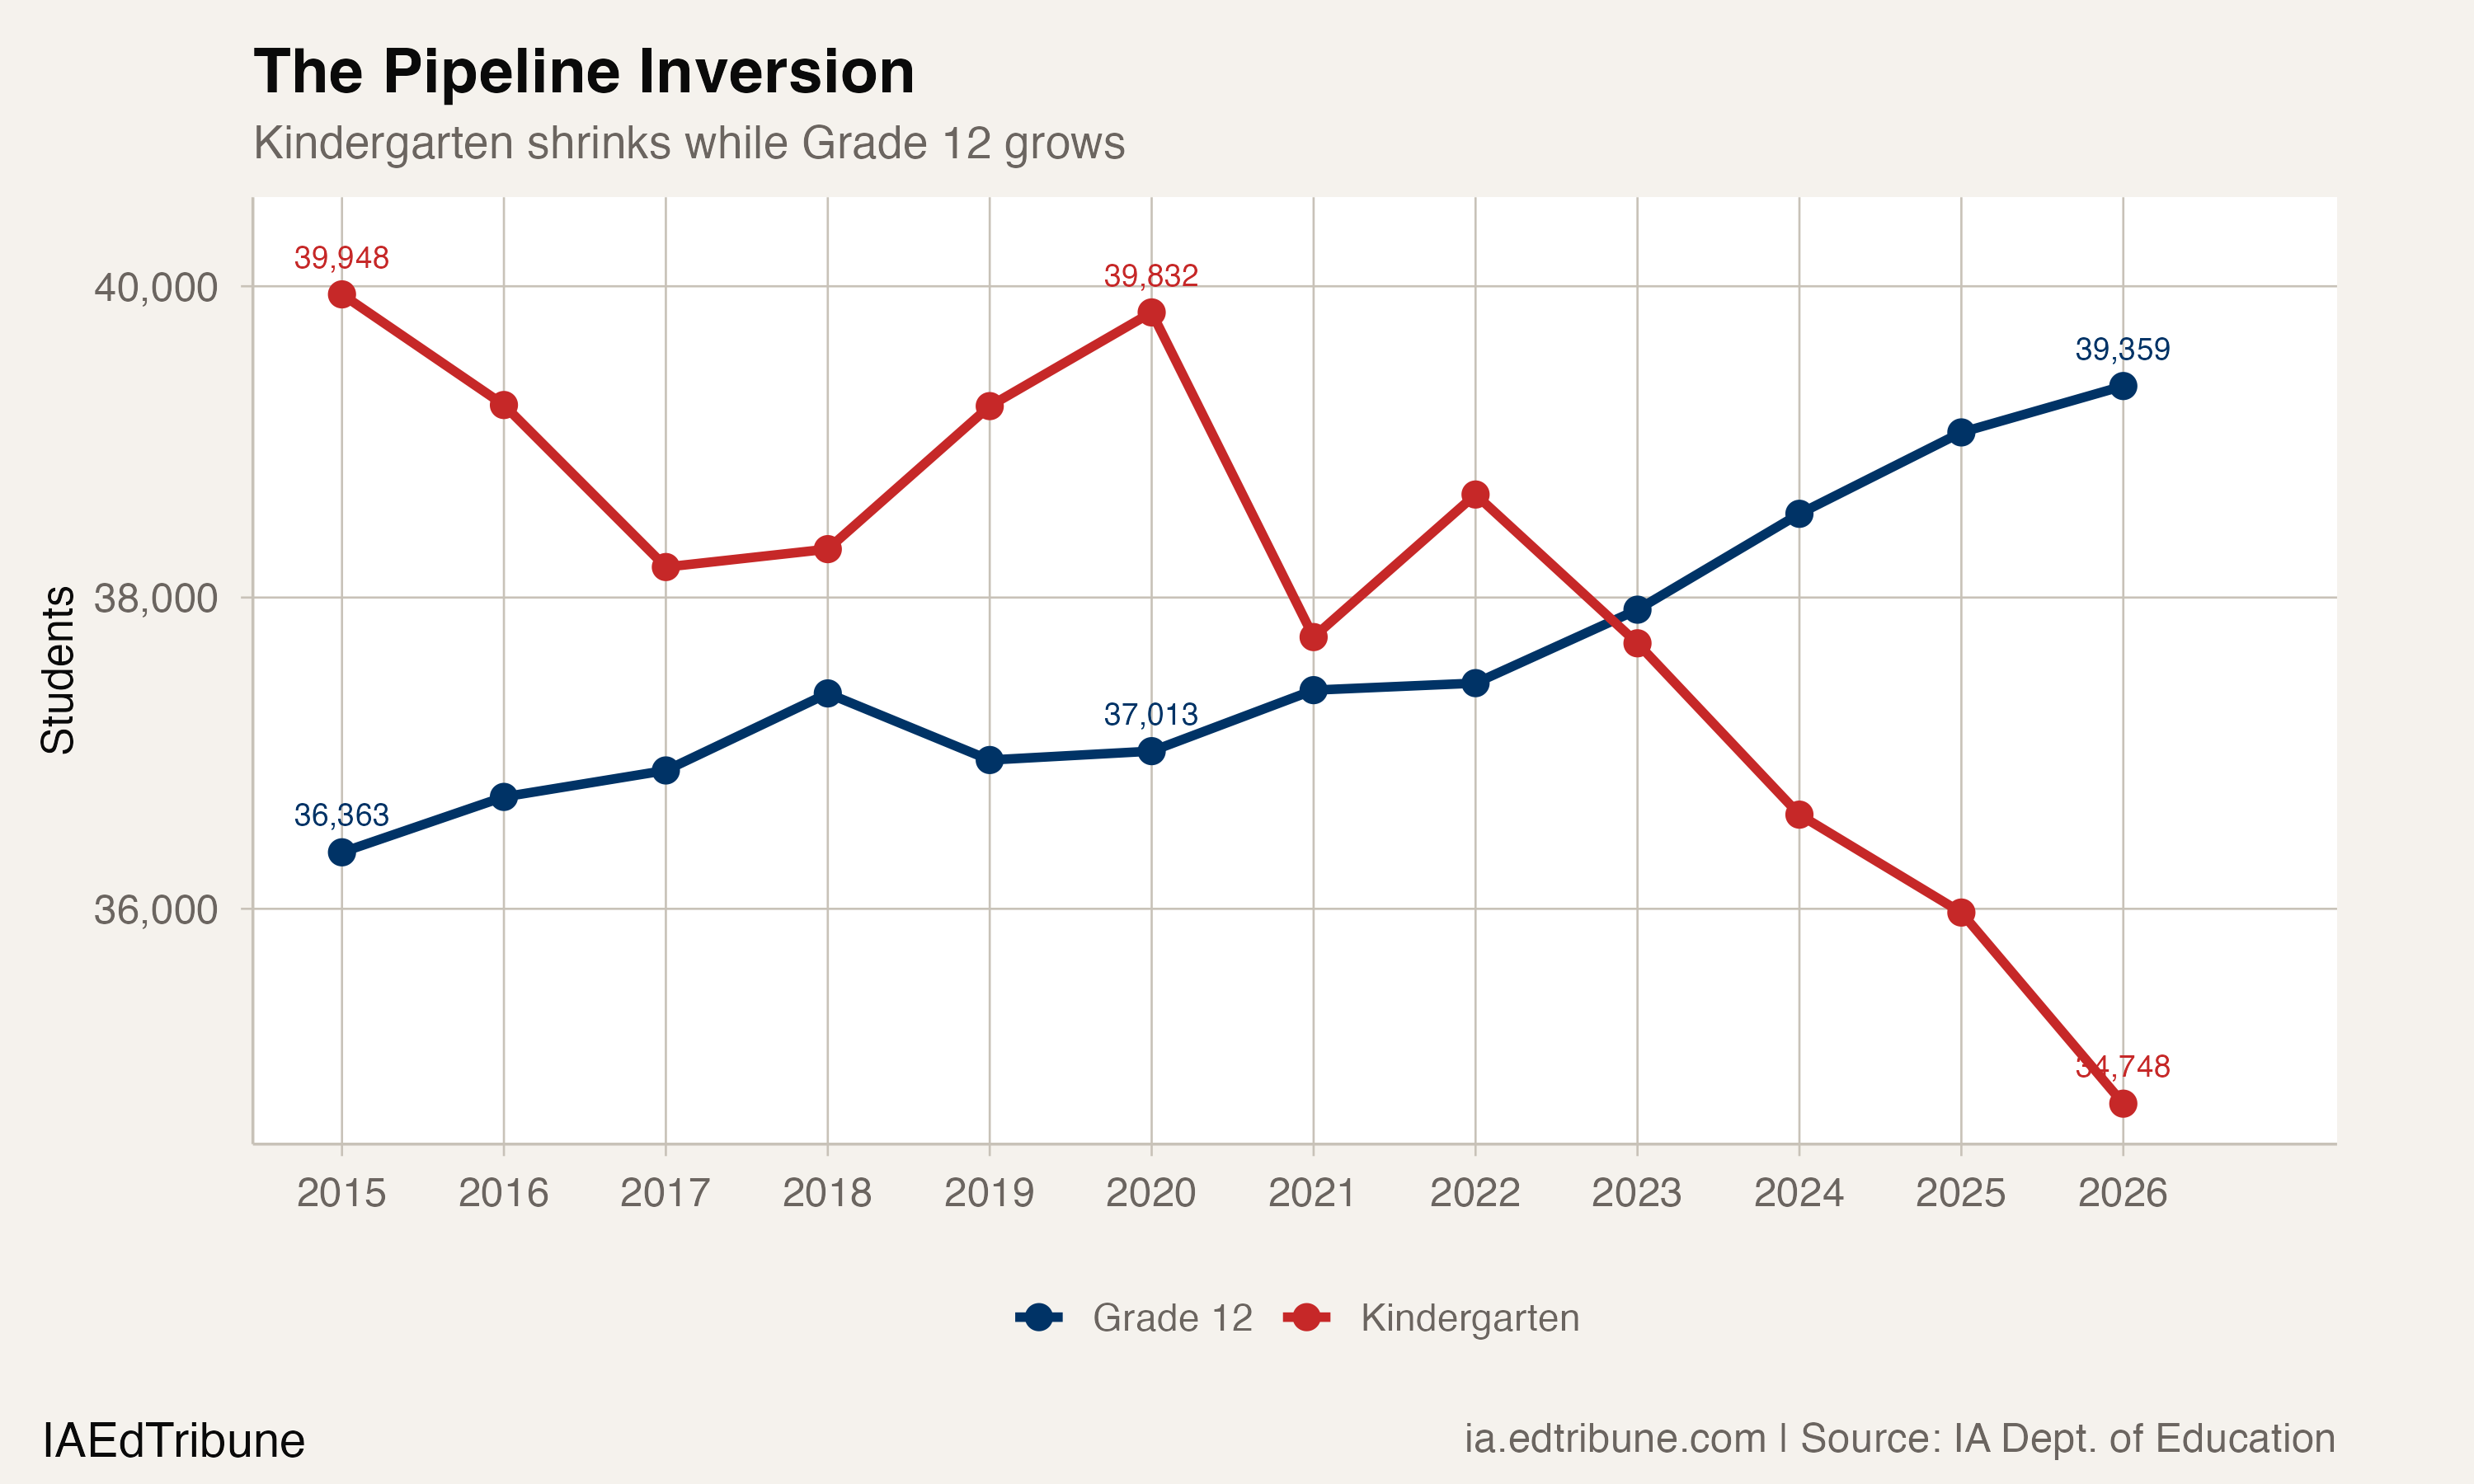
The overall enrollment decline of 1.9% since 2014-15 understates what is coming. Kindergarten enrollment fell 13.0% over the same period, from 39,948 to 34,748. Grade 12, by contrast, grew 8.2%, from 36,363 to 39,359. The two lines crossed in 2023 and have diverged since.
This pipeline inversion means the largest graduating classes in Iowa history are cycling out while the smallest entering classes are cycling in. The gap will widen mechanically for years. Every kindergarten class since 2020 has been smaller than every senior class it will eventually replace.
Iowa's birth rate fell from 12.6 per 1,000 residents in 2015 to 11.2 in 2023. The Iowa Department of Education projects a 3.5% decline in certified enrollment between 2020 and 2030. Public school enrollment alone has already fallen 4.0% from its 2020 peak with four years still to go, suggesting that projection may prove conservative.
Multiple forces, compounding
No single factor explains a 7,670-student annual loss. At least three mechanisms are operating simultaneously, and the data cannot isolate their individual contributions.
Birth rate decline is the structural driver. Fewer children are being born in Iowa, and that arithmetic is visible in the shrinking kindergarten pipeline. This would produce gradual decline even if nothing else changed.
The Students First ESA program, Iowa's education savings account voucher system launched in 2023, expanded to all K-12 students regardless of income in 2025-26. The Iowa Department of Education reports 41,044 ESA users in the current year, and 98% of private school students now use a voucher. Private school enrollment rose 6.5% while public enrollment fell 1.5%. However, the Iowa Department of Education has noted that since the program's launch, public enrollment has declined by 6,254 while private enrollment is up 5,997. Those numbers are close but not identical, and the causal chain is unclear: many ESA recipients were already in private school before the program existed. The share who actually switched from public to private is smaller than the total ESA count suggests.
Open enrollment transfers also redistribute students. More than 44,500 students, about 9% of total enrollment, attend a public school outside their home district. This does not reduce the statewide total, but it concentrates losses in urban cores while inflating suburban districts. Des Moines alone saw open enrollment transfers rise from 1,500 to 2,900 students between 2019-20 and 2024-25, at roughly $7,800 per student in funding that follows them out.
Immigration enforcement is a newer factor that is difficult to quantify. Nationally, half of educators surveyed who work with immigrant families reported students expressing fear or anxiety in 2025, and 15% reported enrollment declines. Iowa's Hispanic student population had been the one consistent growth engine in the enrollment data. Whether that growth stalled or reversed in 2025-26, and whether enforcement is the reason, cannot be determined from aggregate enrollment counts alone.
What reporting suggests
The Iowa Department of Education characterized the decline as part of national trends:
"Declining K-12 enrollment is a long-standing national trend driven by lower birth rates and fewer students progressing from grade to grade." -- Iowa Department of Education, Dec. 2025
That framing does not address why Iowa's decline accelerated so sharply in 2025-26. The national average decline is roughly 0.5% per year. Iowa's 1.52% drop is triple that rate.
Des Moines, the state's largest district, is planning for a smaller future. The district lost 5,117 students from its 2017-18 peak of 34,020 to its current 28,903. It cut $14 million from its budget ahead of 2024-25 and unveiled a 10-year "Reimagining Education" plan that includes consolidating middle schools from 10 to five, creating signature schools to compete for open enrollment transfers, and expanding full-day preschool.
Waukee, 20 miles west of Des Moines, tells the opposite story. It grew from 8,639 to 14,281 students since 2014-15, a 65.3% increase. Ankeny added 2,098 students (+19.8%). The suburban ring is absorbing what the urban core is losing, a dynamic repeated in metro areas across the state.
157 districts on the budget guarantee
For 2025-26, 157 of Iowa's 327 public school districts qualify for the budget guarantee, up from 140 the prior year. The guarantee ensures districts receive a minimum 1% increase in regular program costs even when enrollment falls, but the difference is funded by local property taxes rather than state aid. The cost of that guarantee rose from $15.5 million to $24.3 million in a single year.
Nearly half the state's districts now depend on a fiscal backstop designed for temporary enrollment dips. When the dips are structural, the backstop becomes a permanent subsidy that shifts costs from the state to local taxpayers.
Labor costs represent 80% to 90% of district budgets. A district losing 50 students per year cannot easily cut half a teaching position. The losses accumulate until a threshold forces an abrupt reorganization: closing a building, eliminating a program, sharing a superintendent with a neighboring district. The legislature recently raised the operational sharing cap from 21 to 25 positions, allowing more districts to pool staff and still receive state funding incentives.
The 2030 question
If Iowa's enrollment decline continues at the three-year average rate of roughly 4,900 students per year, the state would fall below 475,000 by 2030. If the 2025-26 rate of 7,670 per year persists, it would reach that threshold by 2029.
Neither projection is a forecast. Birth rates could stabilize. ESA transfers could plateau as the program matures. New immigration could resume. But the pipeline data offers no such comfort. The 2025-26 kindergarten class of 34,748 will not produce a senior class of 39,359. The mechanical math of smaller cohorts replacing larger ones will continue regardless of policy changes, because those children have already been born, or not.
The question for Iowa's 327 districts is not whether to plan for smaller enrollment. It is whether 327 districts is the right number to serve a student population that peaked in 2020 and shows no structural reason to stop shrinking.
Detailed code that reproduces the analysis and figures in this article is available exclusively to EdTribune subscribers.
Discussion
Sign in to join the discussion.
Loading comments...