In this series: Iowa 2025-26 Enrollment.
Five years after COVID emptied Iowa classrooms, the students never came back. And the losses kept deepening.
Of 223 Iowa districts that lost enrollment between 2019 and 2021, only 38 have fully recovered to their pre-pandemic levels. The other 185 remain underwater. Of those, 164 districts, 73.5% of COVID losers, have enrollment below even their pandemic-year lows. They did not bounce back partway and stall. They kept sinking.
The conventional narrative of COVID enrollment loss assumed a disruption followed by a recovery. Iowa got the disruption. The recovery lasted two years, clawed back less than half the losses, and then reversed into something worse.
The false bounce
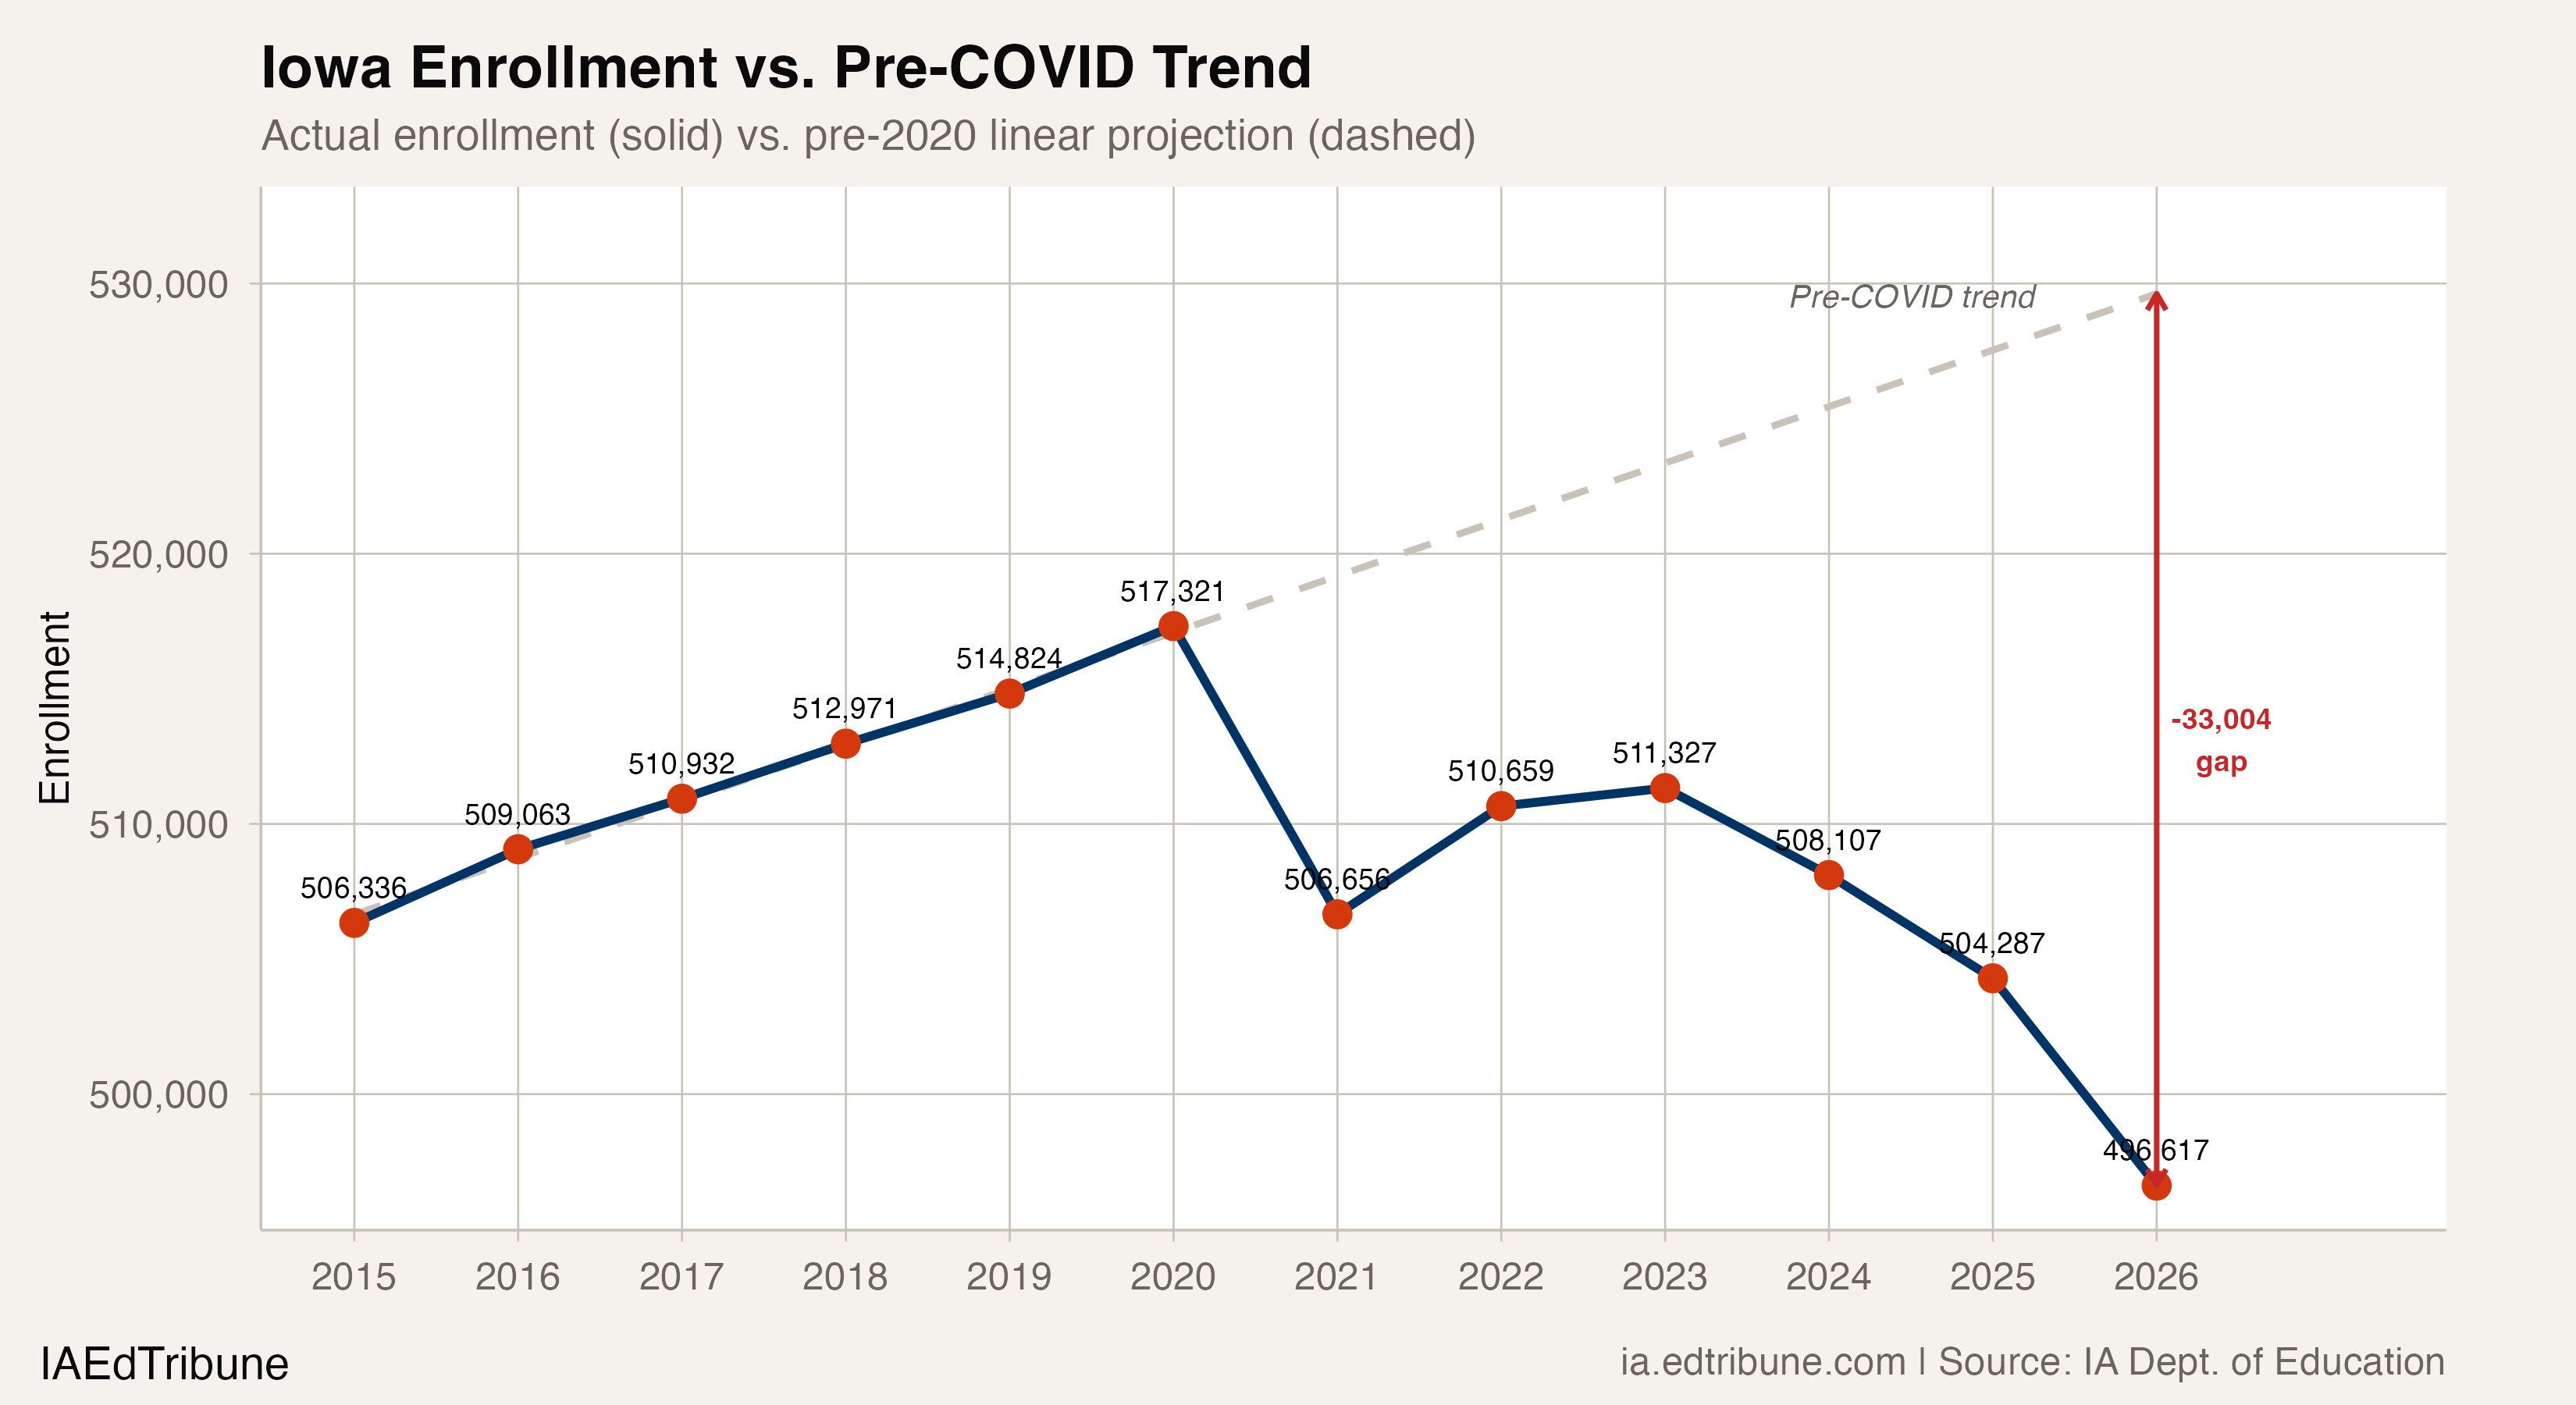
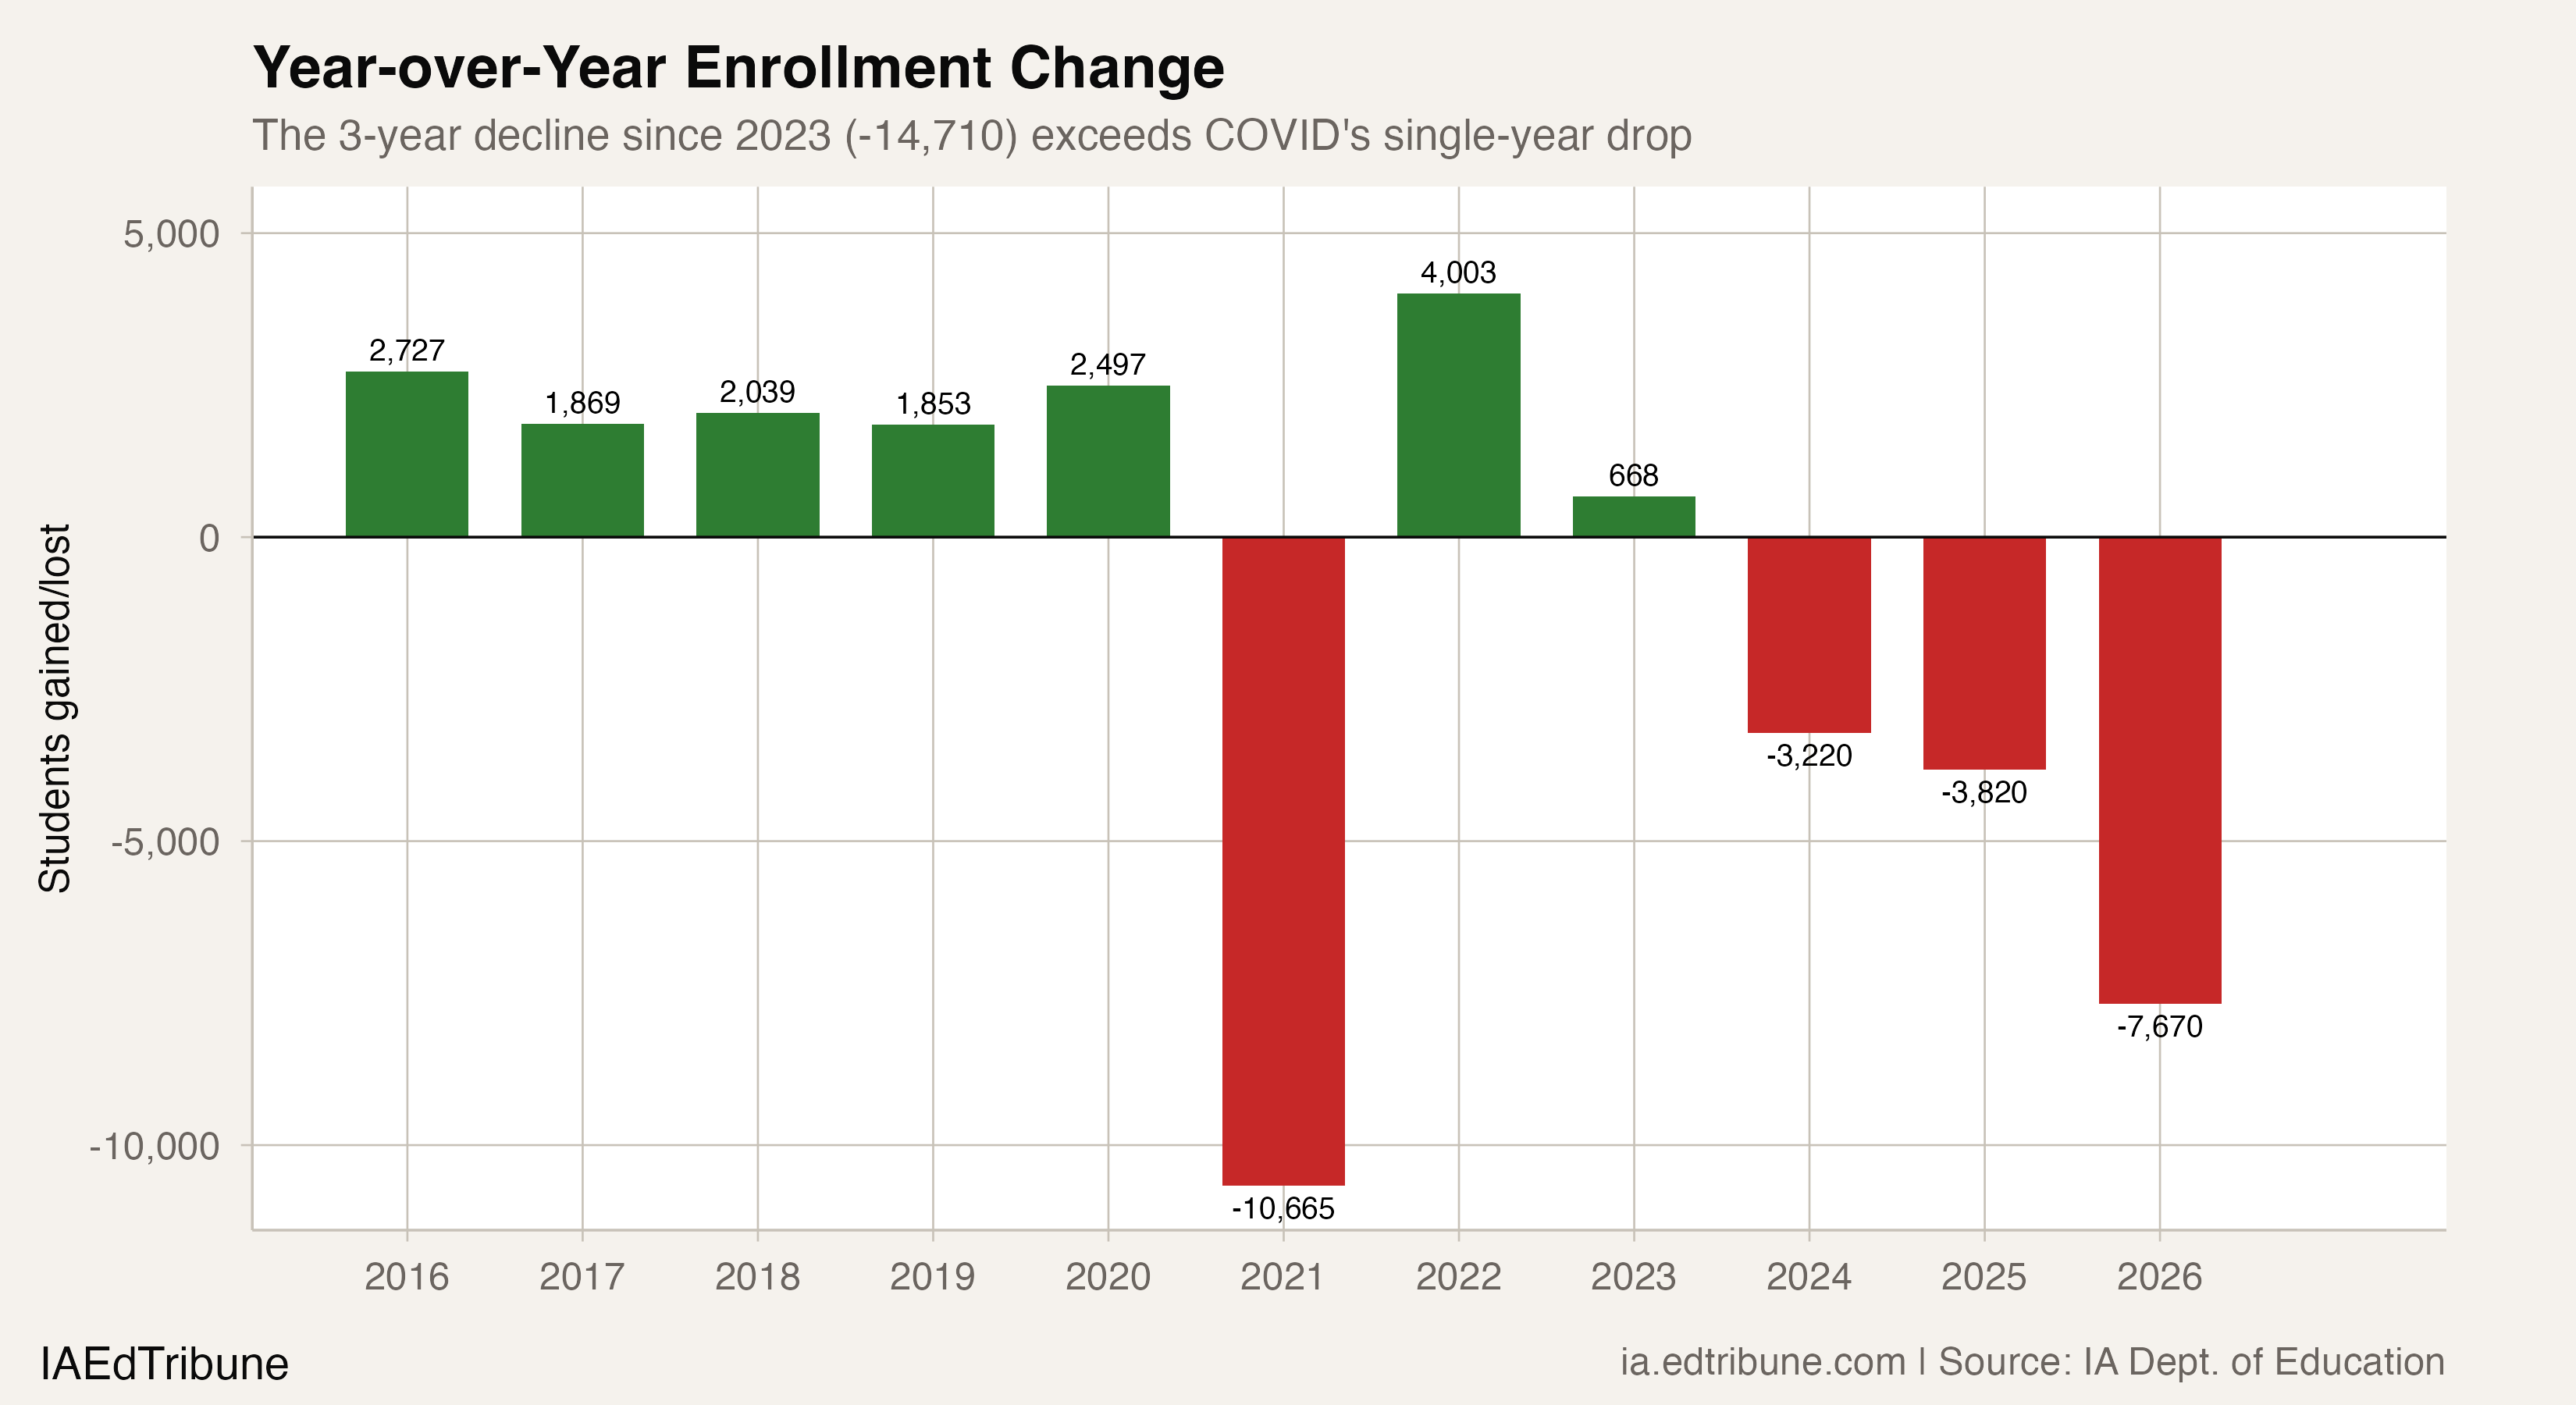
Iowa was growing before COVID. From 2015 through 2020, the state added an average of 2,164 students per year, reaching a peak of 517,321 in 2020. Then the pandemic hit: 10,665 students vanished in a single year, dropping enrollment to 506,656 by fall 2021.
What followed looked like a recovery. Iowa gained 4,003 students in 2022 and another 668 in 2023, reaching 511,327. But those two years recovered only 43.8% of the COVID loss, and the gains evaporated immediately. Enrollment fell by 3,220 in 2024, 3,820 in 2025, and 7,670 in 2026.
The three-year decline from 2023 to 2026, totaling 14,710 students, now exceeds the single-year COVID crash of 10,665. Iowa is losing students faster in peacetime than it did during a pandemic.
Had pre-COVID growth continued at its 2015-2019 rate, Iowa would have enrolled 529,621 students in fall 2025. The actual count of 496,617 leaves a gap of 33,004 students, 6.2% of projected enrollment. That projection assumes birth rates and migration patterns would have held steady, which is generous. Even so, the gap illustrates the scale of what was lost: not just the pandemic's direct hit, but years of compounding decline that followed.
The 164 districts that never stopped bleeding
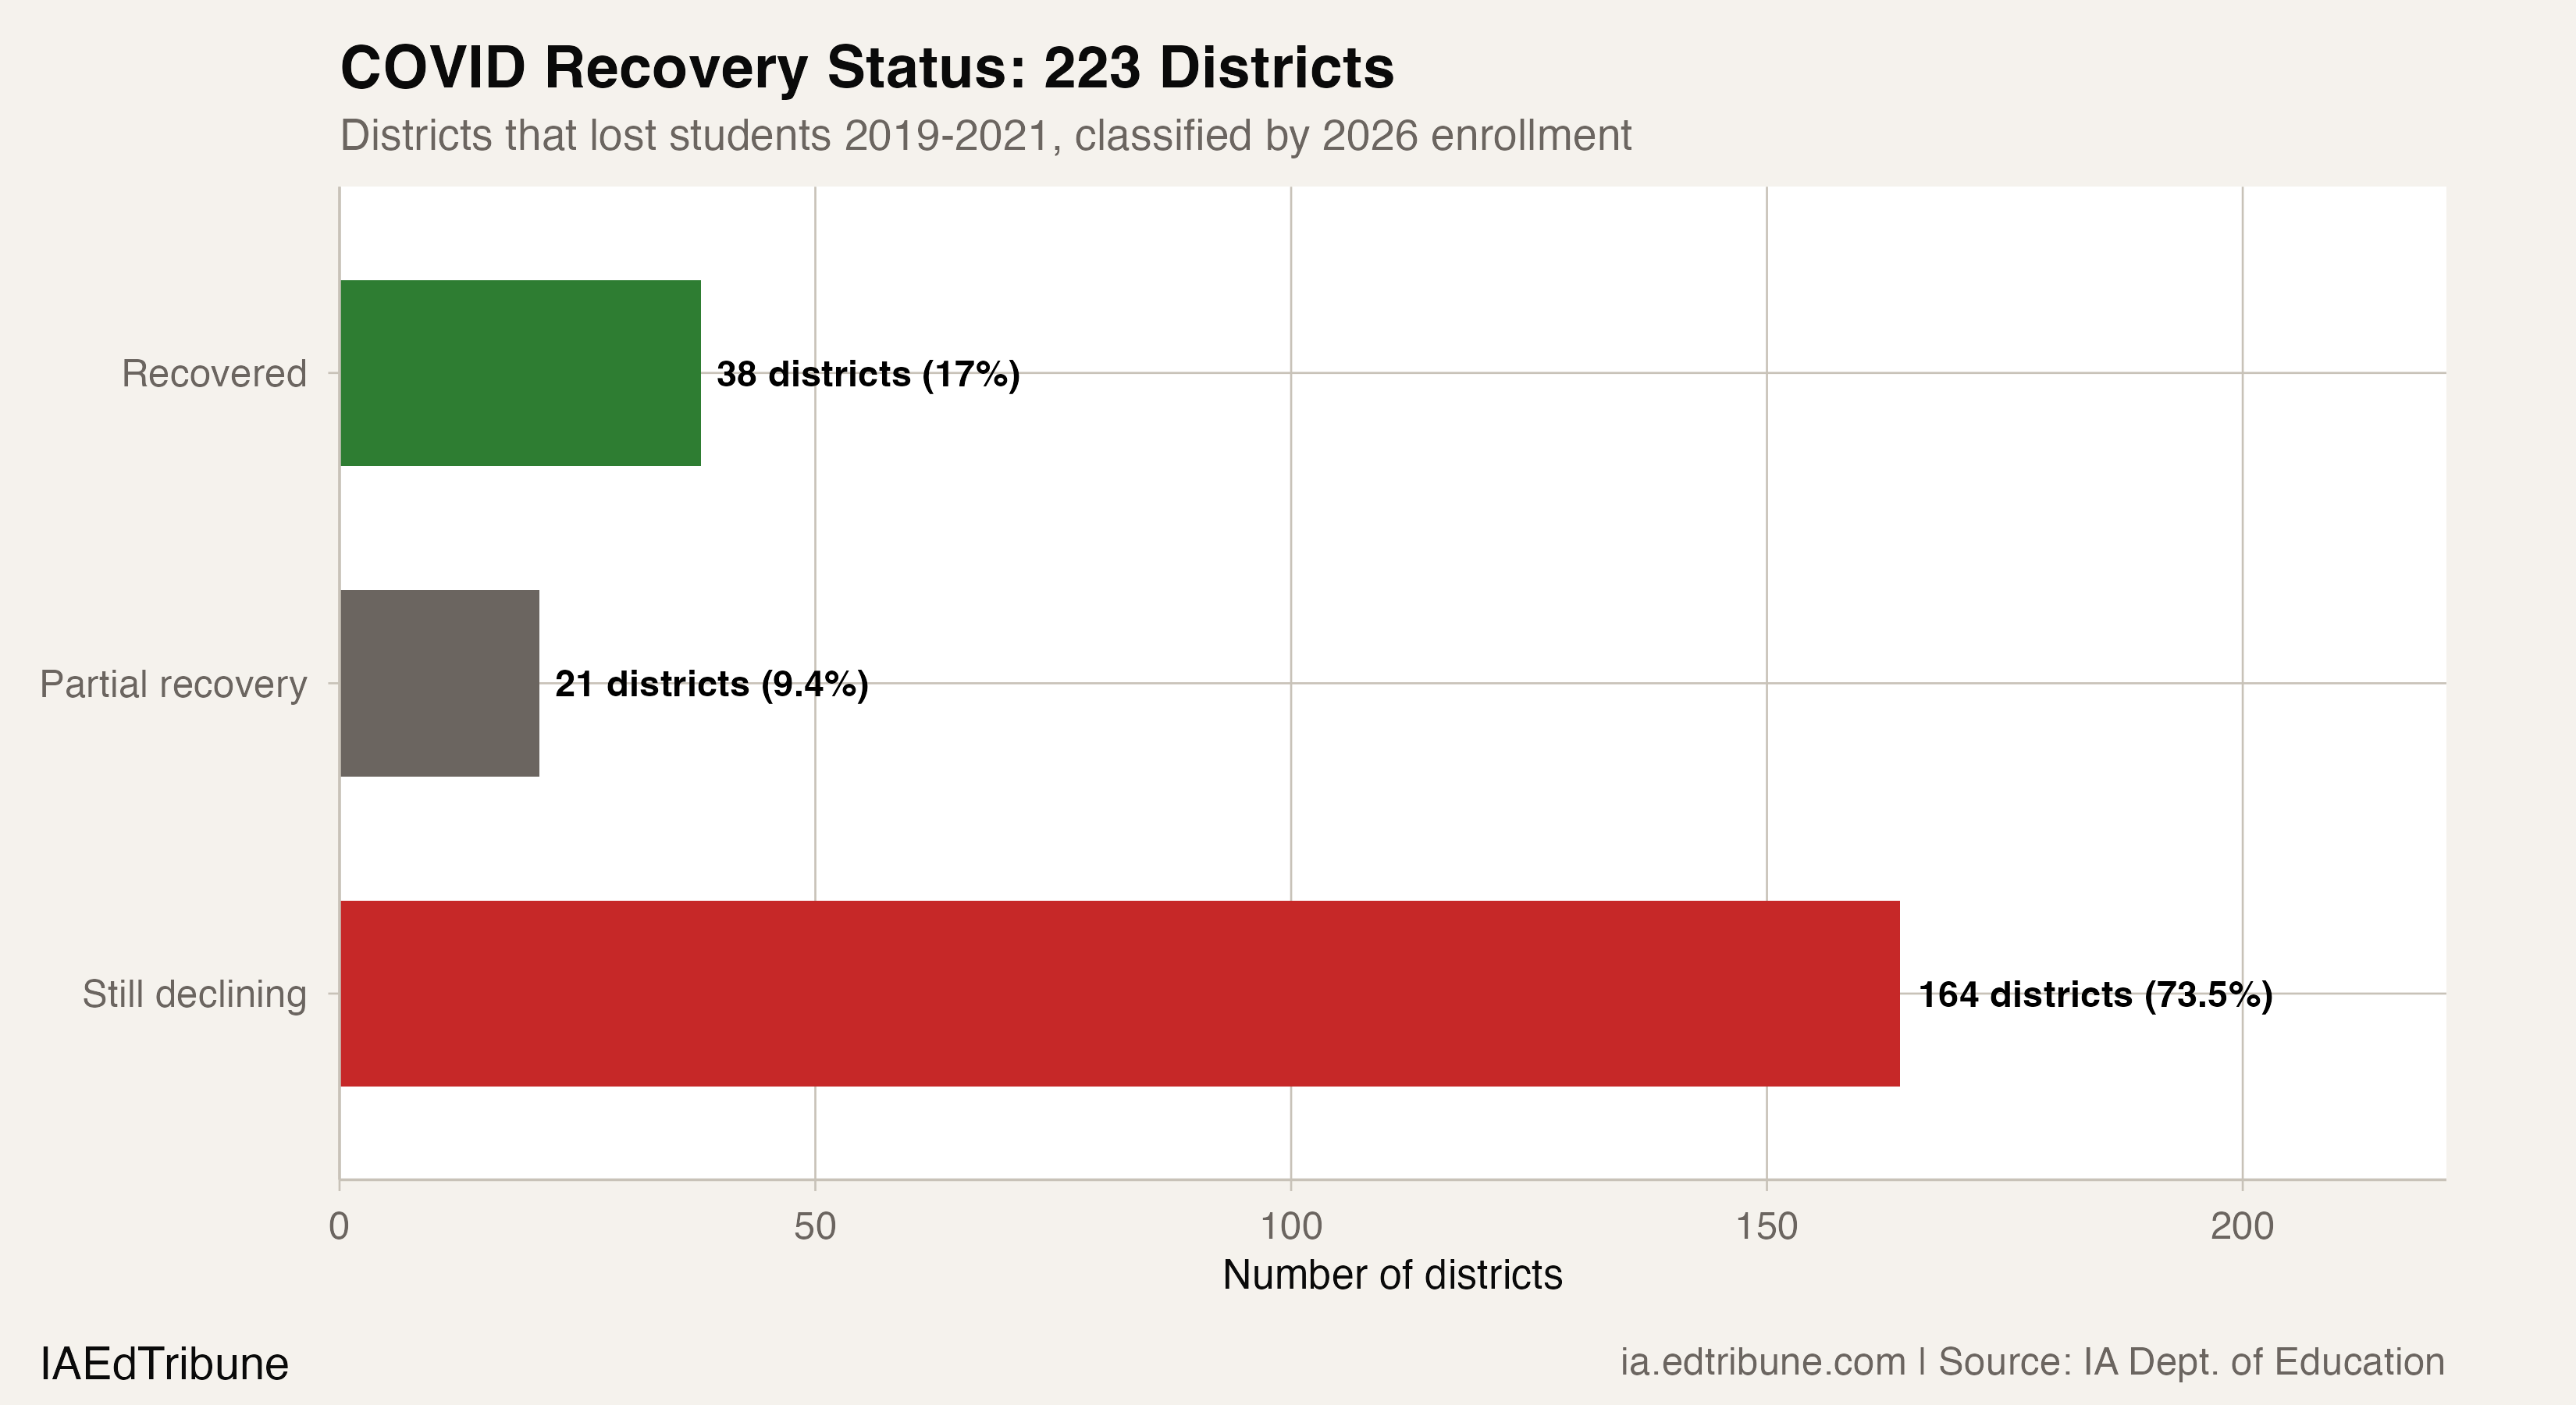
The recovery classification reveals how unevenly Iowa's districts fared. Among the 223 districts that lost students during COVID:
- 164 (73.5%) are still declining, with 2026 enrollment below their 2021 pandemic lows
- 21 (9.4%) partially recovered, sitting between their 2021 and 2019 levels
- 38 (17.0%) fully recovered to pre-COVID enrollment
The 164 still-declining districts collectively enrolled 290,882 students in 2019. By 2026, they are down to 258,941, a loss of 31,941 students. Their average post-COVID decline of 8.9% nearly doubles their average COVID loss of 4.7%. The pandemic did not cause their decline so much as it accelerated a trajectory already in motion.
Mid-sized districts (200 to 4,999 students) have the worst recovery rates. Among districts with 200 to 499 students in 2019, 80.5% are still declining. Among those with 1,000 to 4,999, 78.5% are. The smallest districts (under 200) actually showed the best recovery at 61.5%, though that finding is fragile given only 13 districts in the group.
Des Moines and the urban collapse
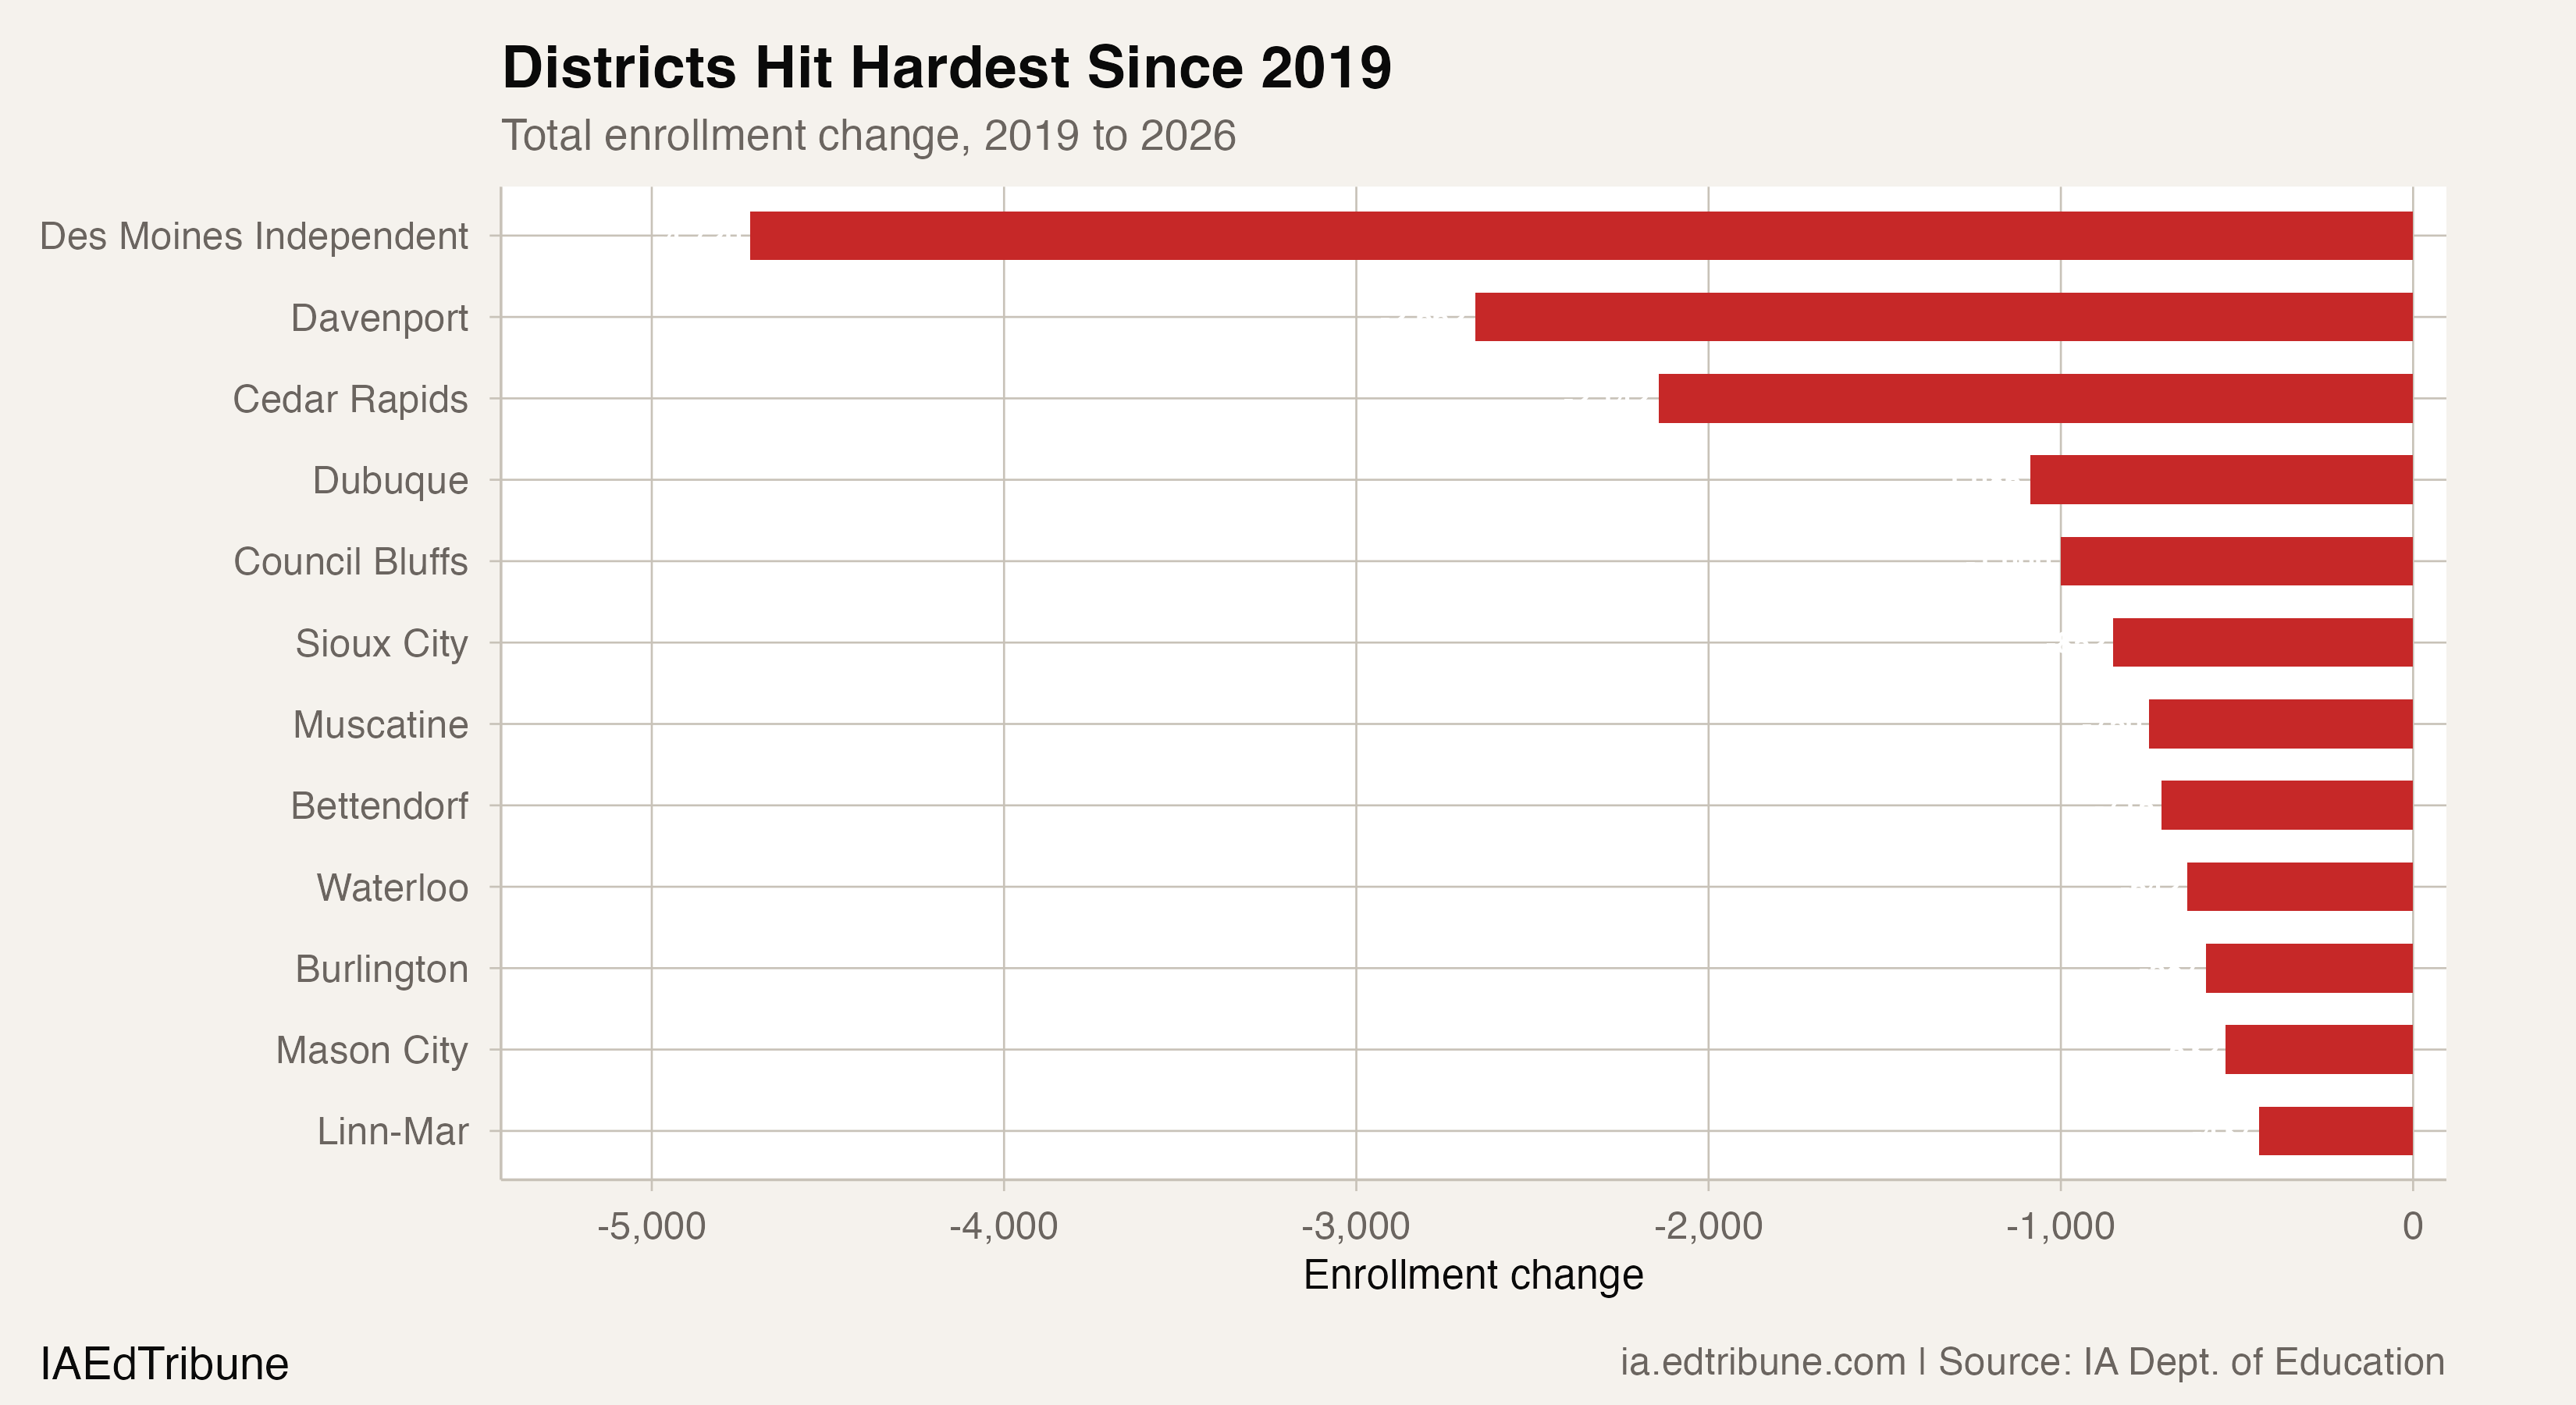
Des Moines lost 1,903 students during COVID. It has since lost another 2,817, bringing its total decline to 4,720 students since 2019, a 14.0% drop. The district that enrolled 33,623 students six years ago now enrolls 28,903.
The pattern repeats across Iowa's largest cities. Davenport lost 2,662 students (17.2%), Cedar Rapids lost 2,142 (12.8%), Dubuque lost 1,086 (9.8%), and Council Bluffs lost 1,000 (11.0%). In every case, the post-COVID losses exceed the initial pandemic losses by a wide margin. Des Moines lost 48% more students after the pandemic than during it. Davenport lost 93% more.
Cedar Rapids presents a particularly stark case. The district has already cut $11 million from its current budget and is planning $13 million more in cuts, including school closures.
"We're not losing 600 students from one building, so, because that's spread around, we still have all the same overhead." -- Cindy Garlock, Cedar Rapids School Board, KCRG, Feb 2026
That quote captures the structural bind. When enrollment declines are distributed across many buildings rather than concentrated in one, districts cannot easily close facilities or cut teaching positions. The costs remain fixed while the revenue shrinks.
More districts declining than during COVID itself
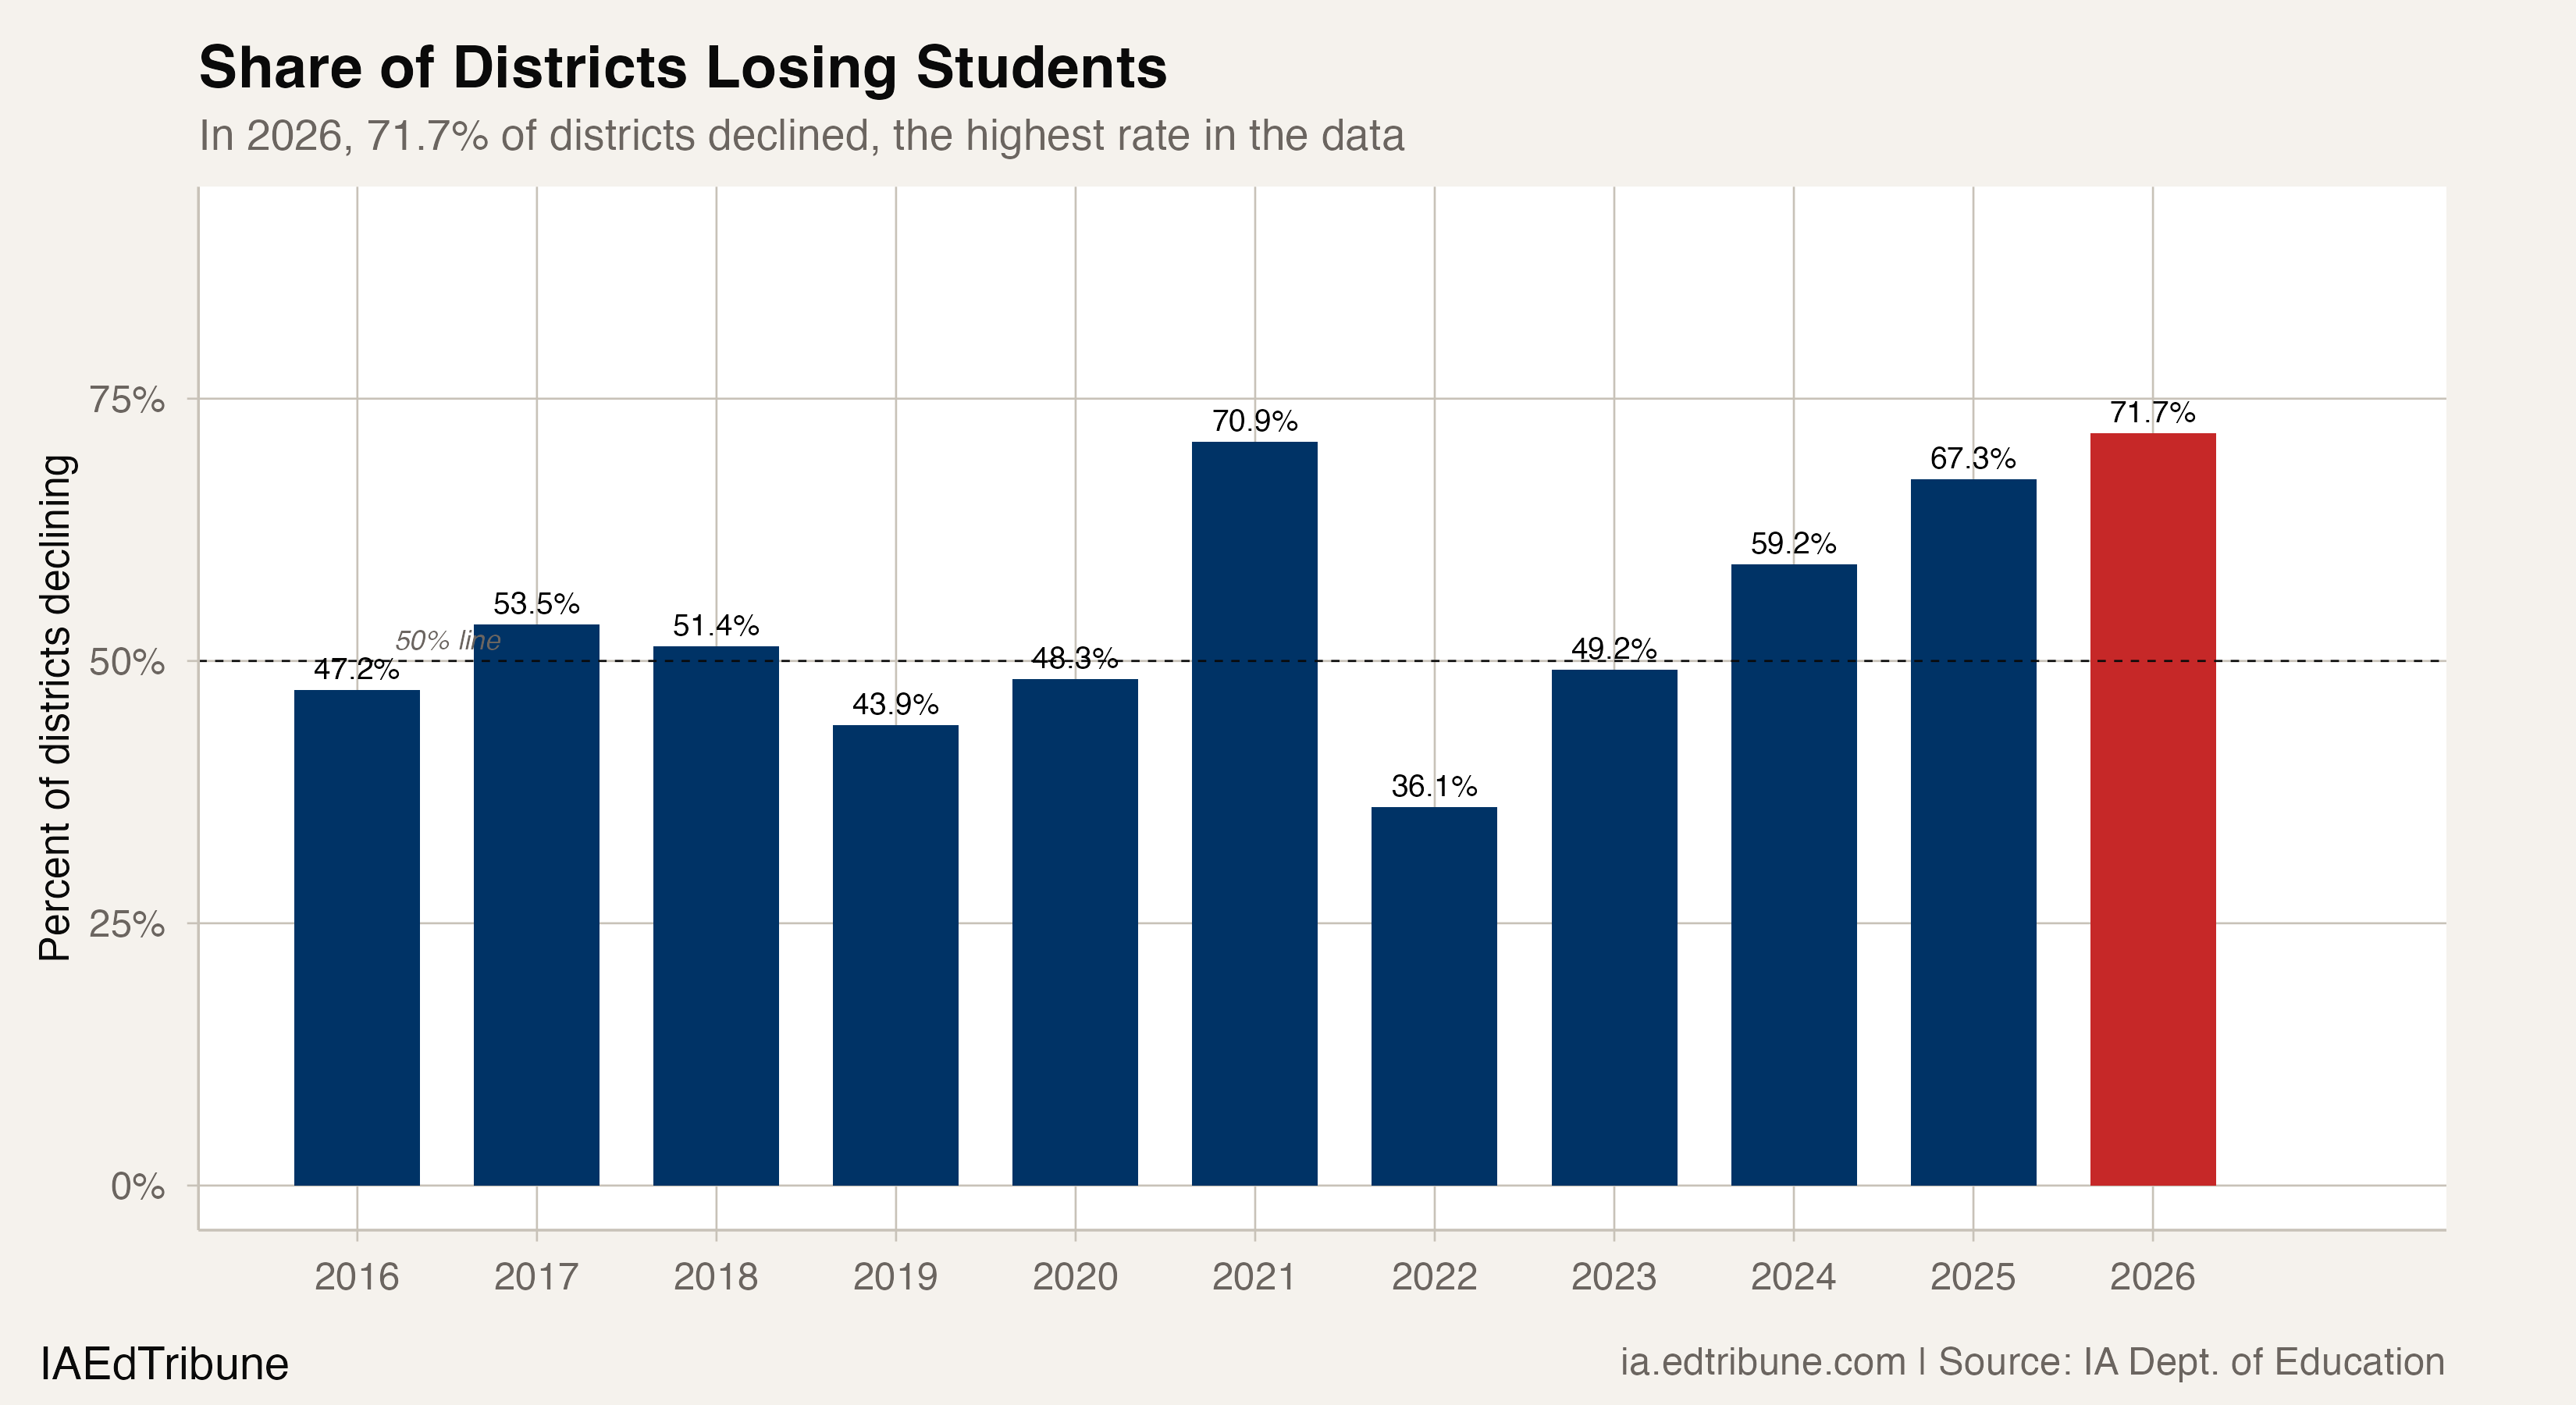
In 2021, the worst year of the pandemic, 70.9% of Iowa districts lost students. In 2026, that figure is 71.7%, the highest in the dataset. The post-bounce years show a steady march upward: 49.2% of districts declined in 2023, 59.2% in 2024, 67.3% in 2025, and now 71.7% in 2026.
The 2022 bounce, when only 36.1% of districts declined, was not a turning point. It was a brief interruption.
Three forces compounding
The most likely driver of the sustained decline is demographic. Iowa's birth rate fell from 12.6 per 1,000 residents in 2015 to 11.2 in 2023, feeding progressively smaller kindergarten classes into the pipeline. The National Center for Education Statistics projects a 2.7 million student national decline by 2031.
Iowa's Education Savings Account program, launched in 2023, adds a second pressure. In its first year open to all income levels, 41,044 students used ESAs at nonpublic schools, according to the Iowa Department of Education. Of those, roughly 1,905 switched directly from public schools. The direct transfer number is modest relative to the overall decline, but the program's rapid growth, with private school enrollment up 6.5% in a single year, suggests this pressure is building.
A third factor is harder to measure. Iowa's population growth over the past five years came more than 90% from international immigration, and that pipeline has narrowed sharply. ICE arrested over 1,200 people in Iowa between January and October 2025, and the rate of international immigration dropped by roughly half compared to 2024. Agricultural policy expert David Peters told Iowa Public Radio that without immigration, rural Iowa would have contracted 10 to 12% over the past decade instead of the 2% it actually shrank.
"That's going to have implications for school consolidation, for Main Street businesses, the property tax base." -- David Peters, Iowa Public Radio, Feb 2026
The enrollment data cannot isolate how much each factor contributes. Birth rates operate on a five-year lag, ESA transfers are partially tracked, and immigration effects are largely invisible in enrollment files. What the data does show is that the forces pushing enrollment down are intensifying simultaneously, and no countervailing force has emerged.
The fiscal aftermath
The state's budget guarantee, which cushions districts whose enrollment losses outpace per-pupil aid increases, now covers 157 districts and is projected to reach 208 next year. The guarantee keeps funding from falling below the prior year, but the gap is covered by local property taxes, not state aid. It buys time. It does not buy students.
The parallel story
The 102 districts that gained students during COVID tell a parallel story. Of those, 29 (28.4%) have since fallen below their 2019 levels. Even among COVID "winners," the post-pandemic period has been unkind.
Whether the current decline has a floor is the central uncertainty. If the pattern is primarily demographic, Iowa's kindergarten pipeline, already down 13% from its 2015 level, suggests the steepest losses are still ahead as smaller cohorts age through the system. If ESA transfers accelerate as the program matures and income restrictions are fully removed, the public-school funding base narrows further. If immigration enforcement continues to reduce new arrivals, one of the only forces that had been offsetting rural depopulation weakens.
The 2022 bounce proved that Iowa's enrollment decline can pause briefly. It also proved that a pause is not a recovery. For the 164 districts now below their pandemic lows, the 2019 headcount is gone. The work ahead is learning to run a school system built for 290,000 students with 259,000.
Detailed code that reproduces the analysis and figures in this article is available exclusively to EdTribune subscribers.
Discussion
Sign in to join the discussion.
Loading comments...