In this series: Iowa 2025-26 Enrollment.
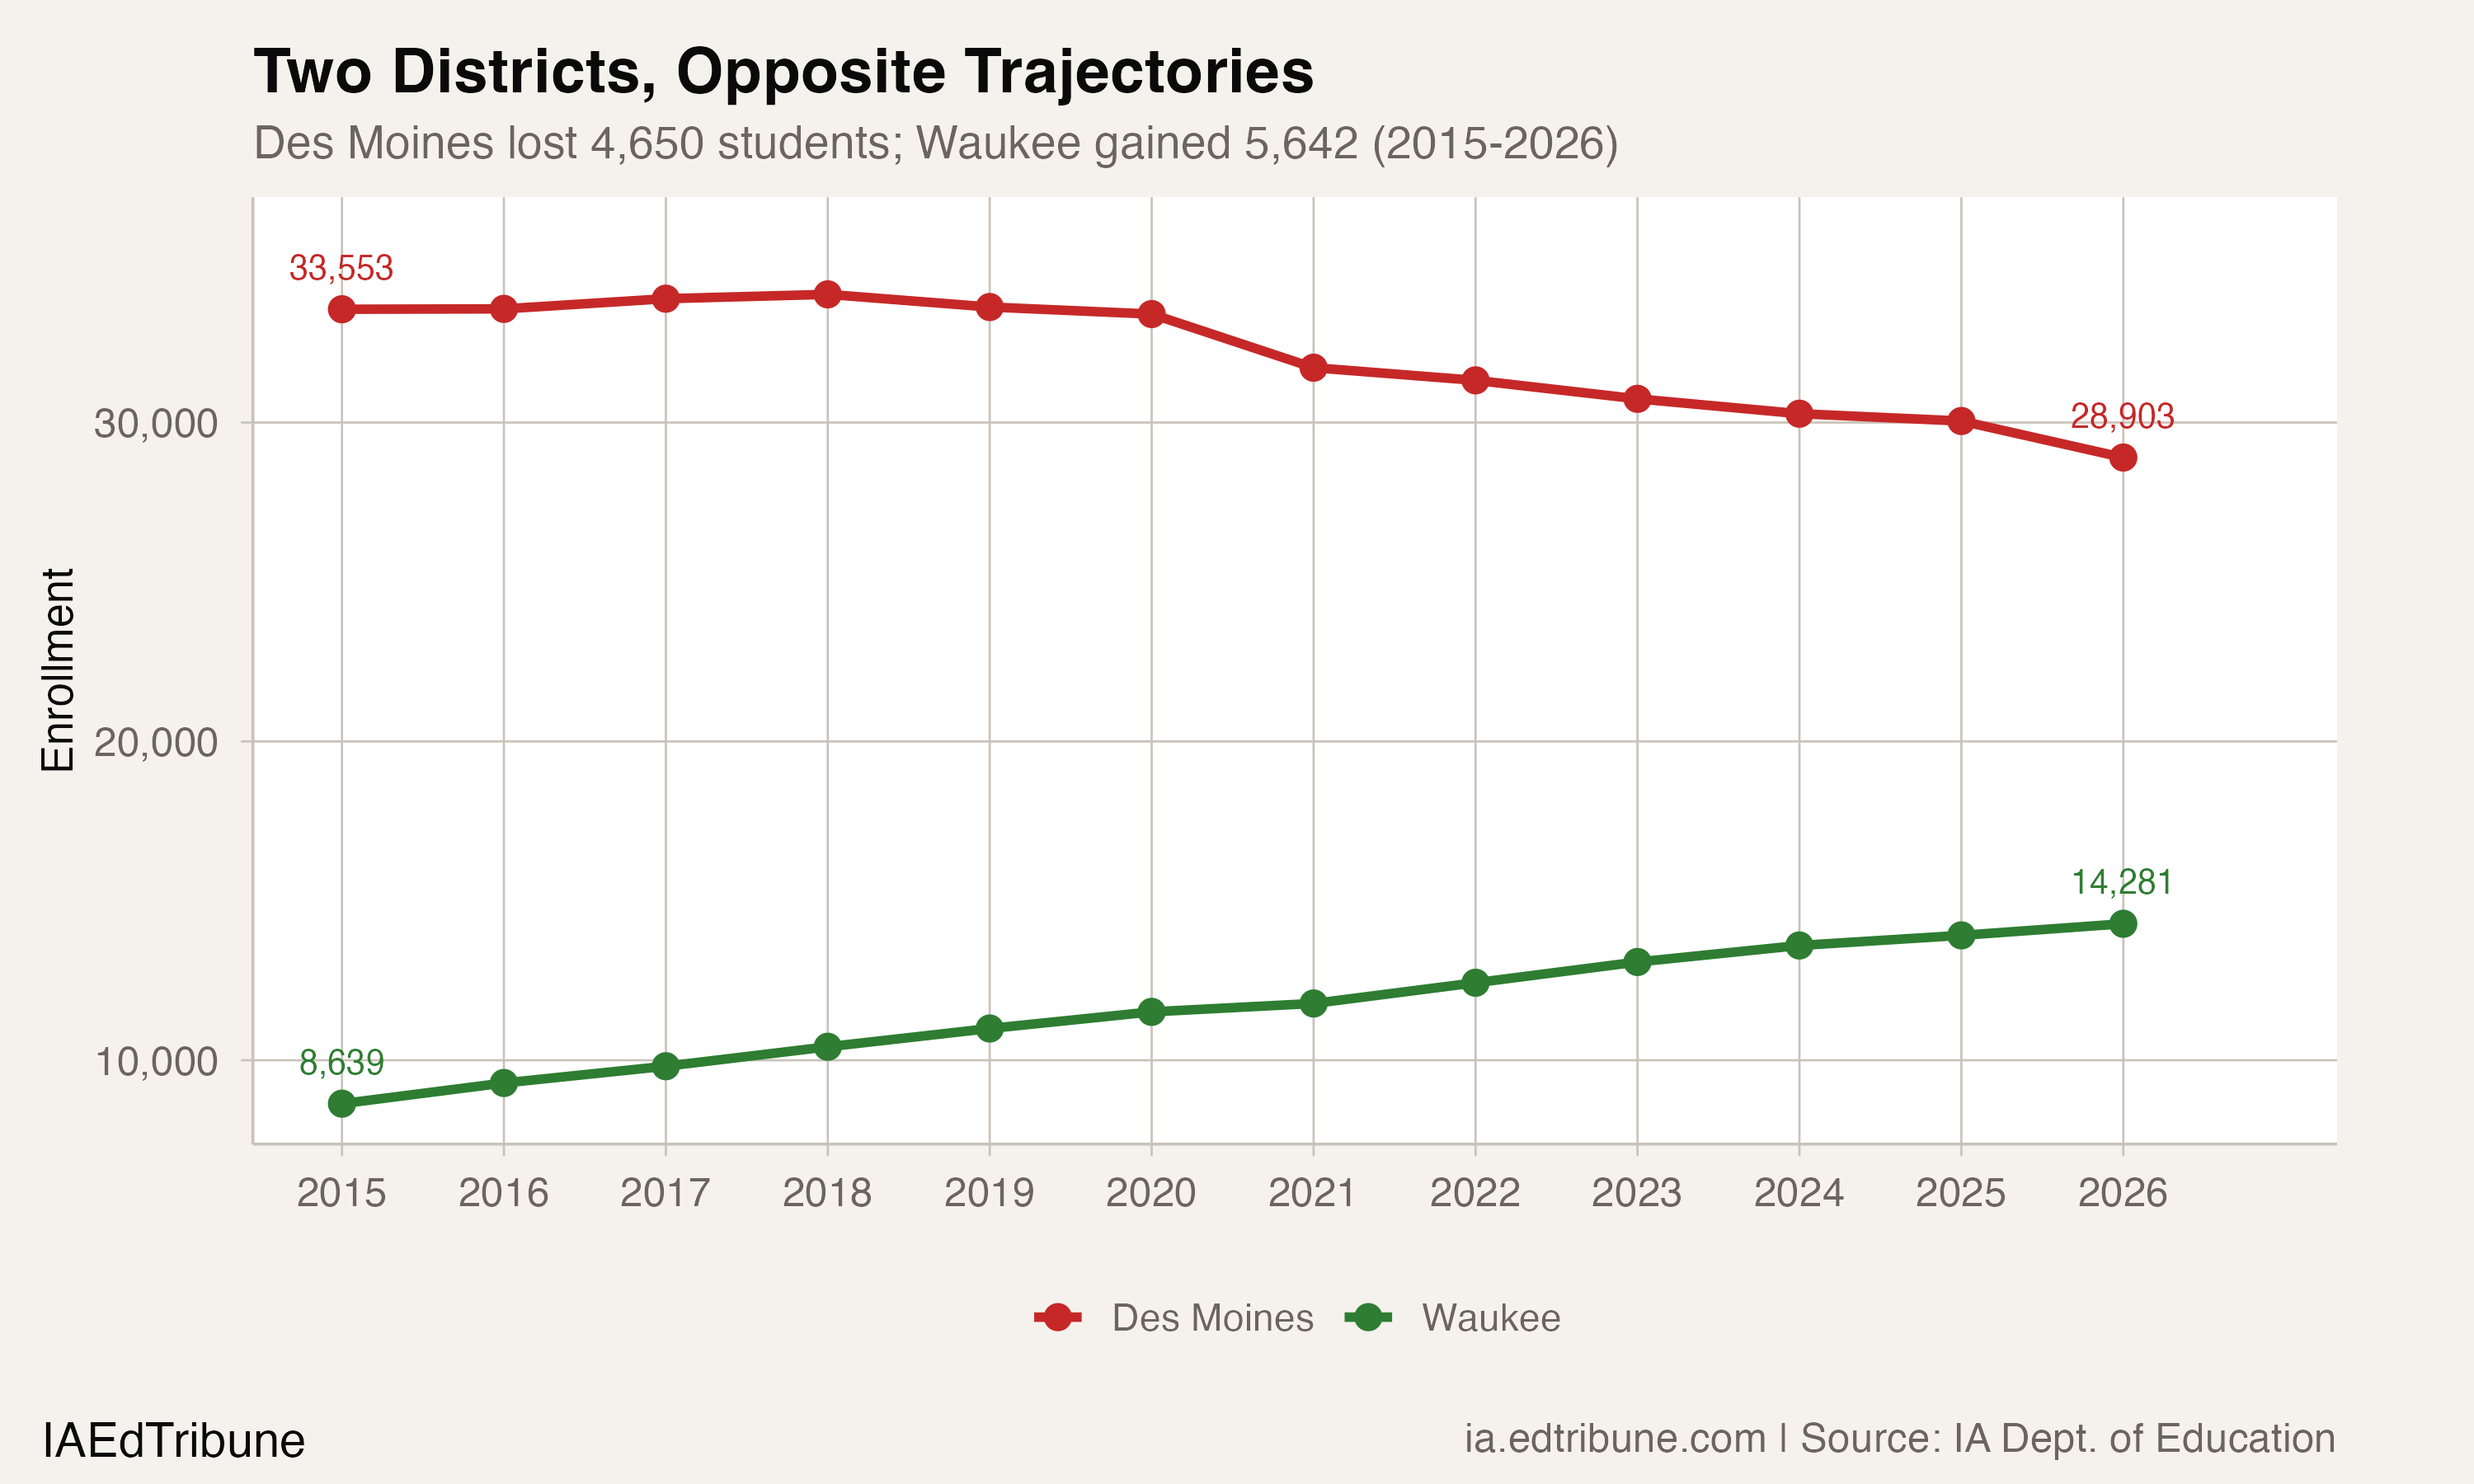
In 2015, Waukee enrolled 8,639 students, ranking 11th among Iowa's school districts. Des Moines, the state's largest, enrolled 33,553. Eleven years later, Waukee has climbed to fourth in the state with 14,281 students, a 65.3% increase. Des Moines has dropped to 28,903, a loss of 4,650 students, 13.9% of its enrollment. The gap between them has narrowed by more than 10,000 students.
The pattern is not unique to these two districts. Across a 15-district metro area, the Des Moines core has shed students every year since 2018 while its suburban ring has grown by nearly 14,000. The metro as a whole gained 9,329 students over the period. The students are not disappearing. They are redistributing.
The donut takes shape
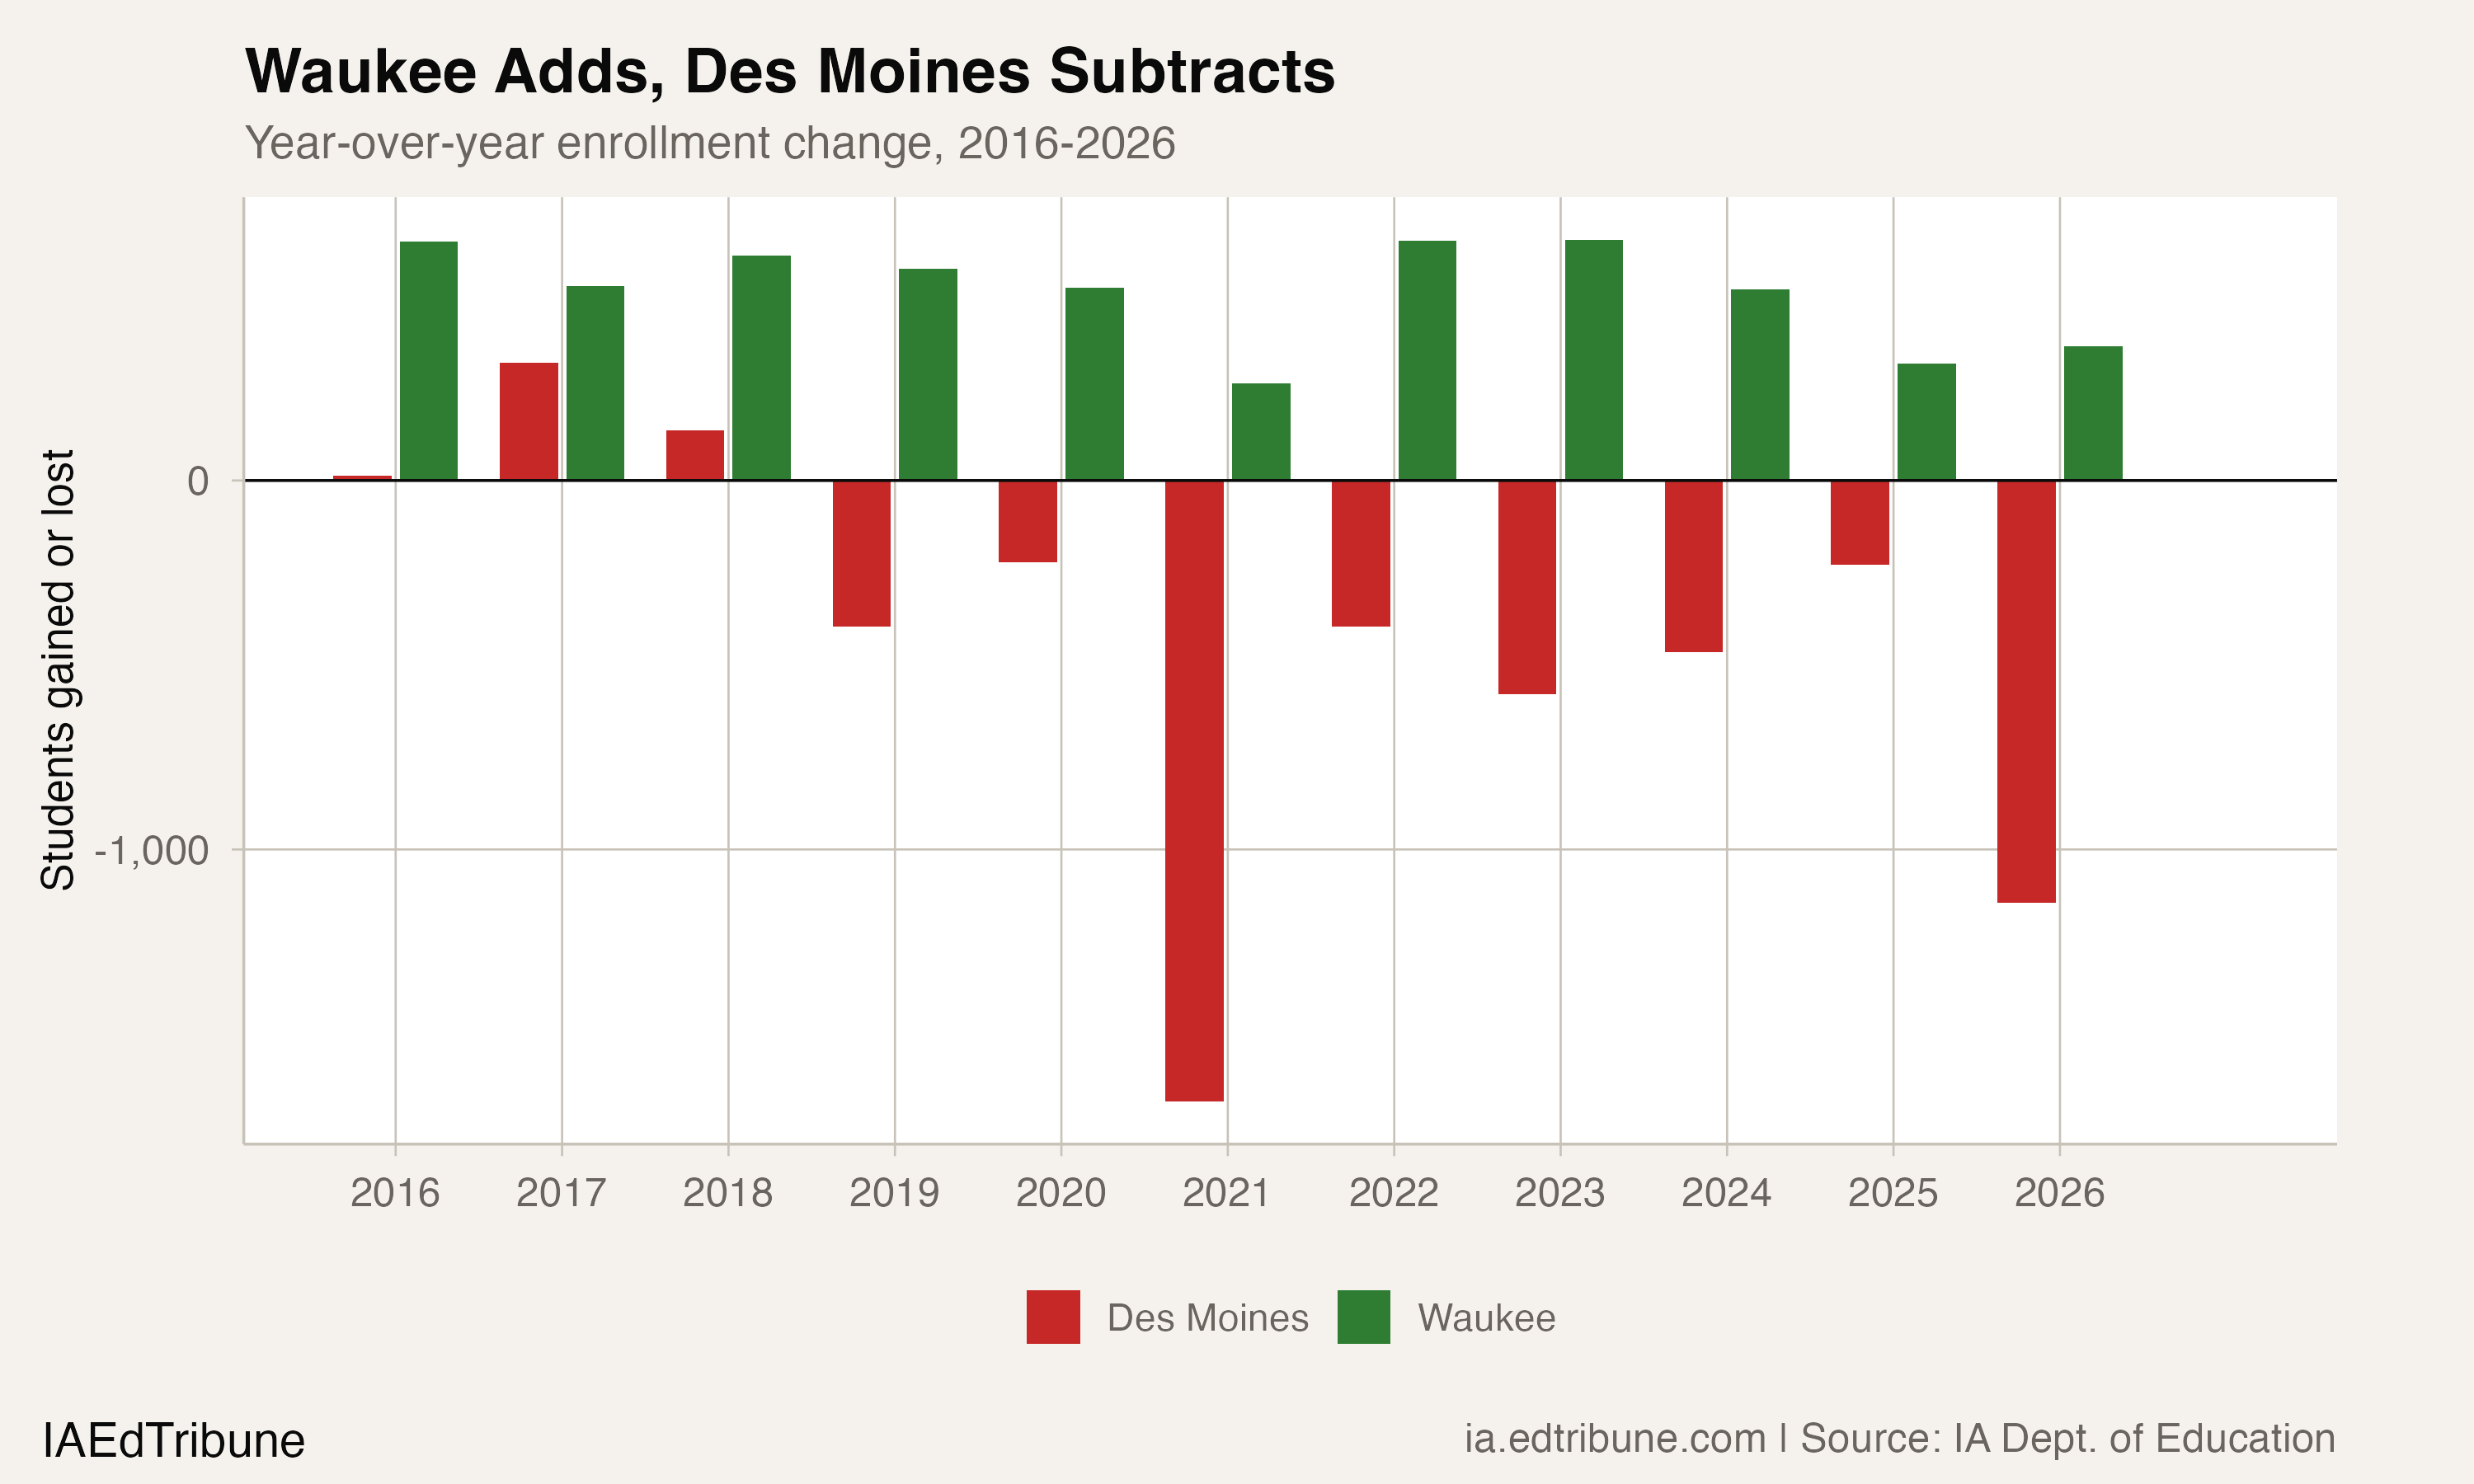
Des Moines peaked at 34,020 students in the 2017-18 school year and has declined every year since, an eight-year streak. The 2025-26 loss of 1,145 students was the steepest single-year drop in that streak, a 3.8% decline that tripled the prior year's loss of 229.
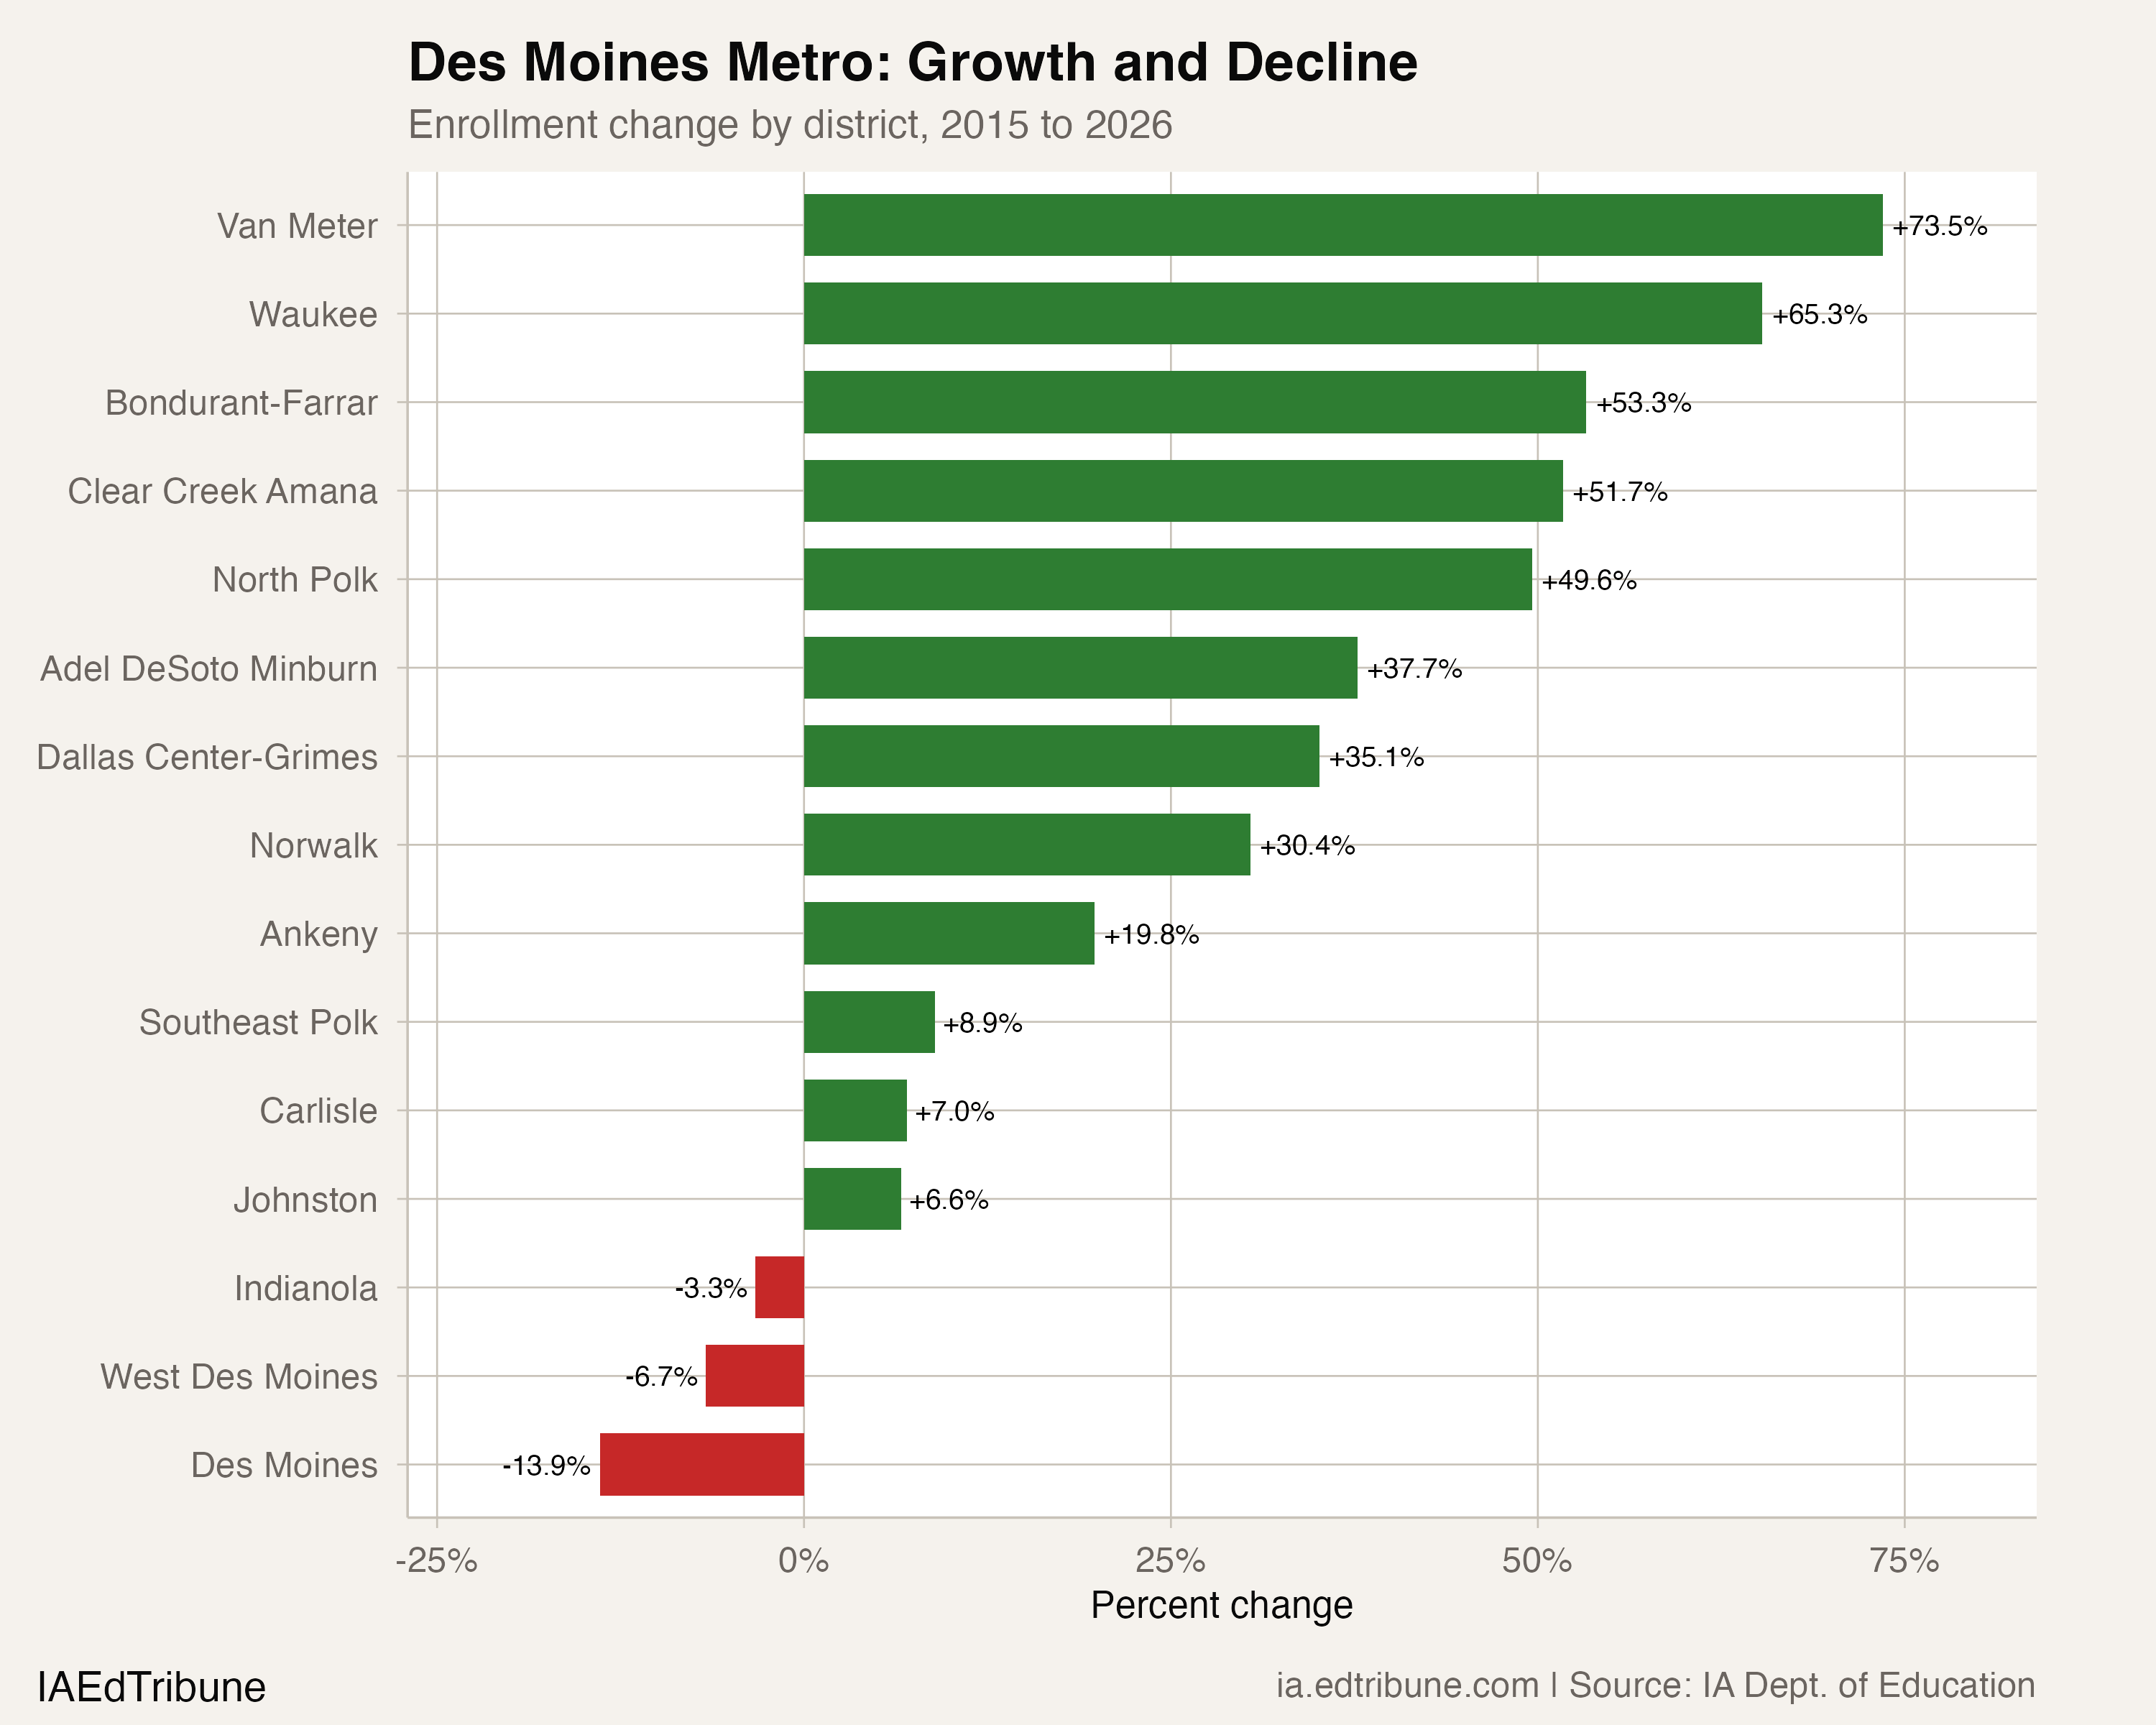
The suburban ring tells the opposite story. Fourteen surrounding districts collectively grew from 61,620 students to 75,599, a gain of 13,979, or 22.7%. Four districts maintained unbroken 11-year growth streaks spanning every year from 2015-16 through 2025-26: Waukee (+65.3%), Bondurant-Farrar (+53.3%), Van Meter (+73.5%), and Clear Creek Amana (+51.7%). Not a single year of decline in any of them across the entire data window.
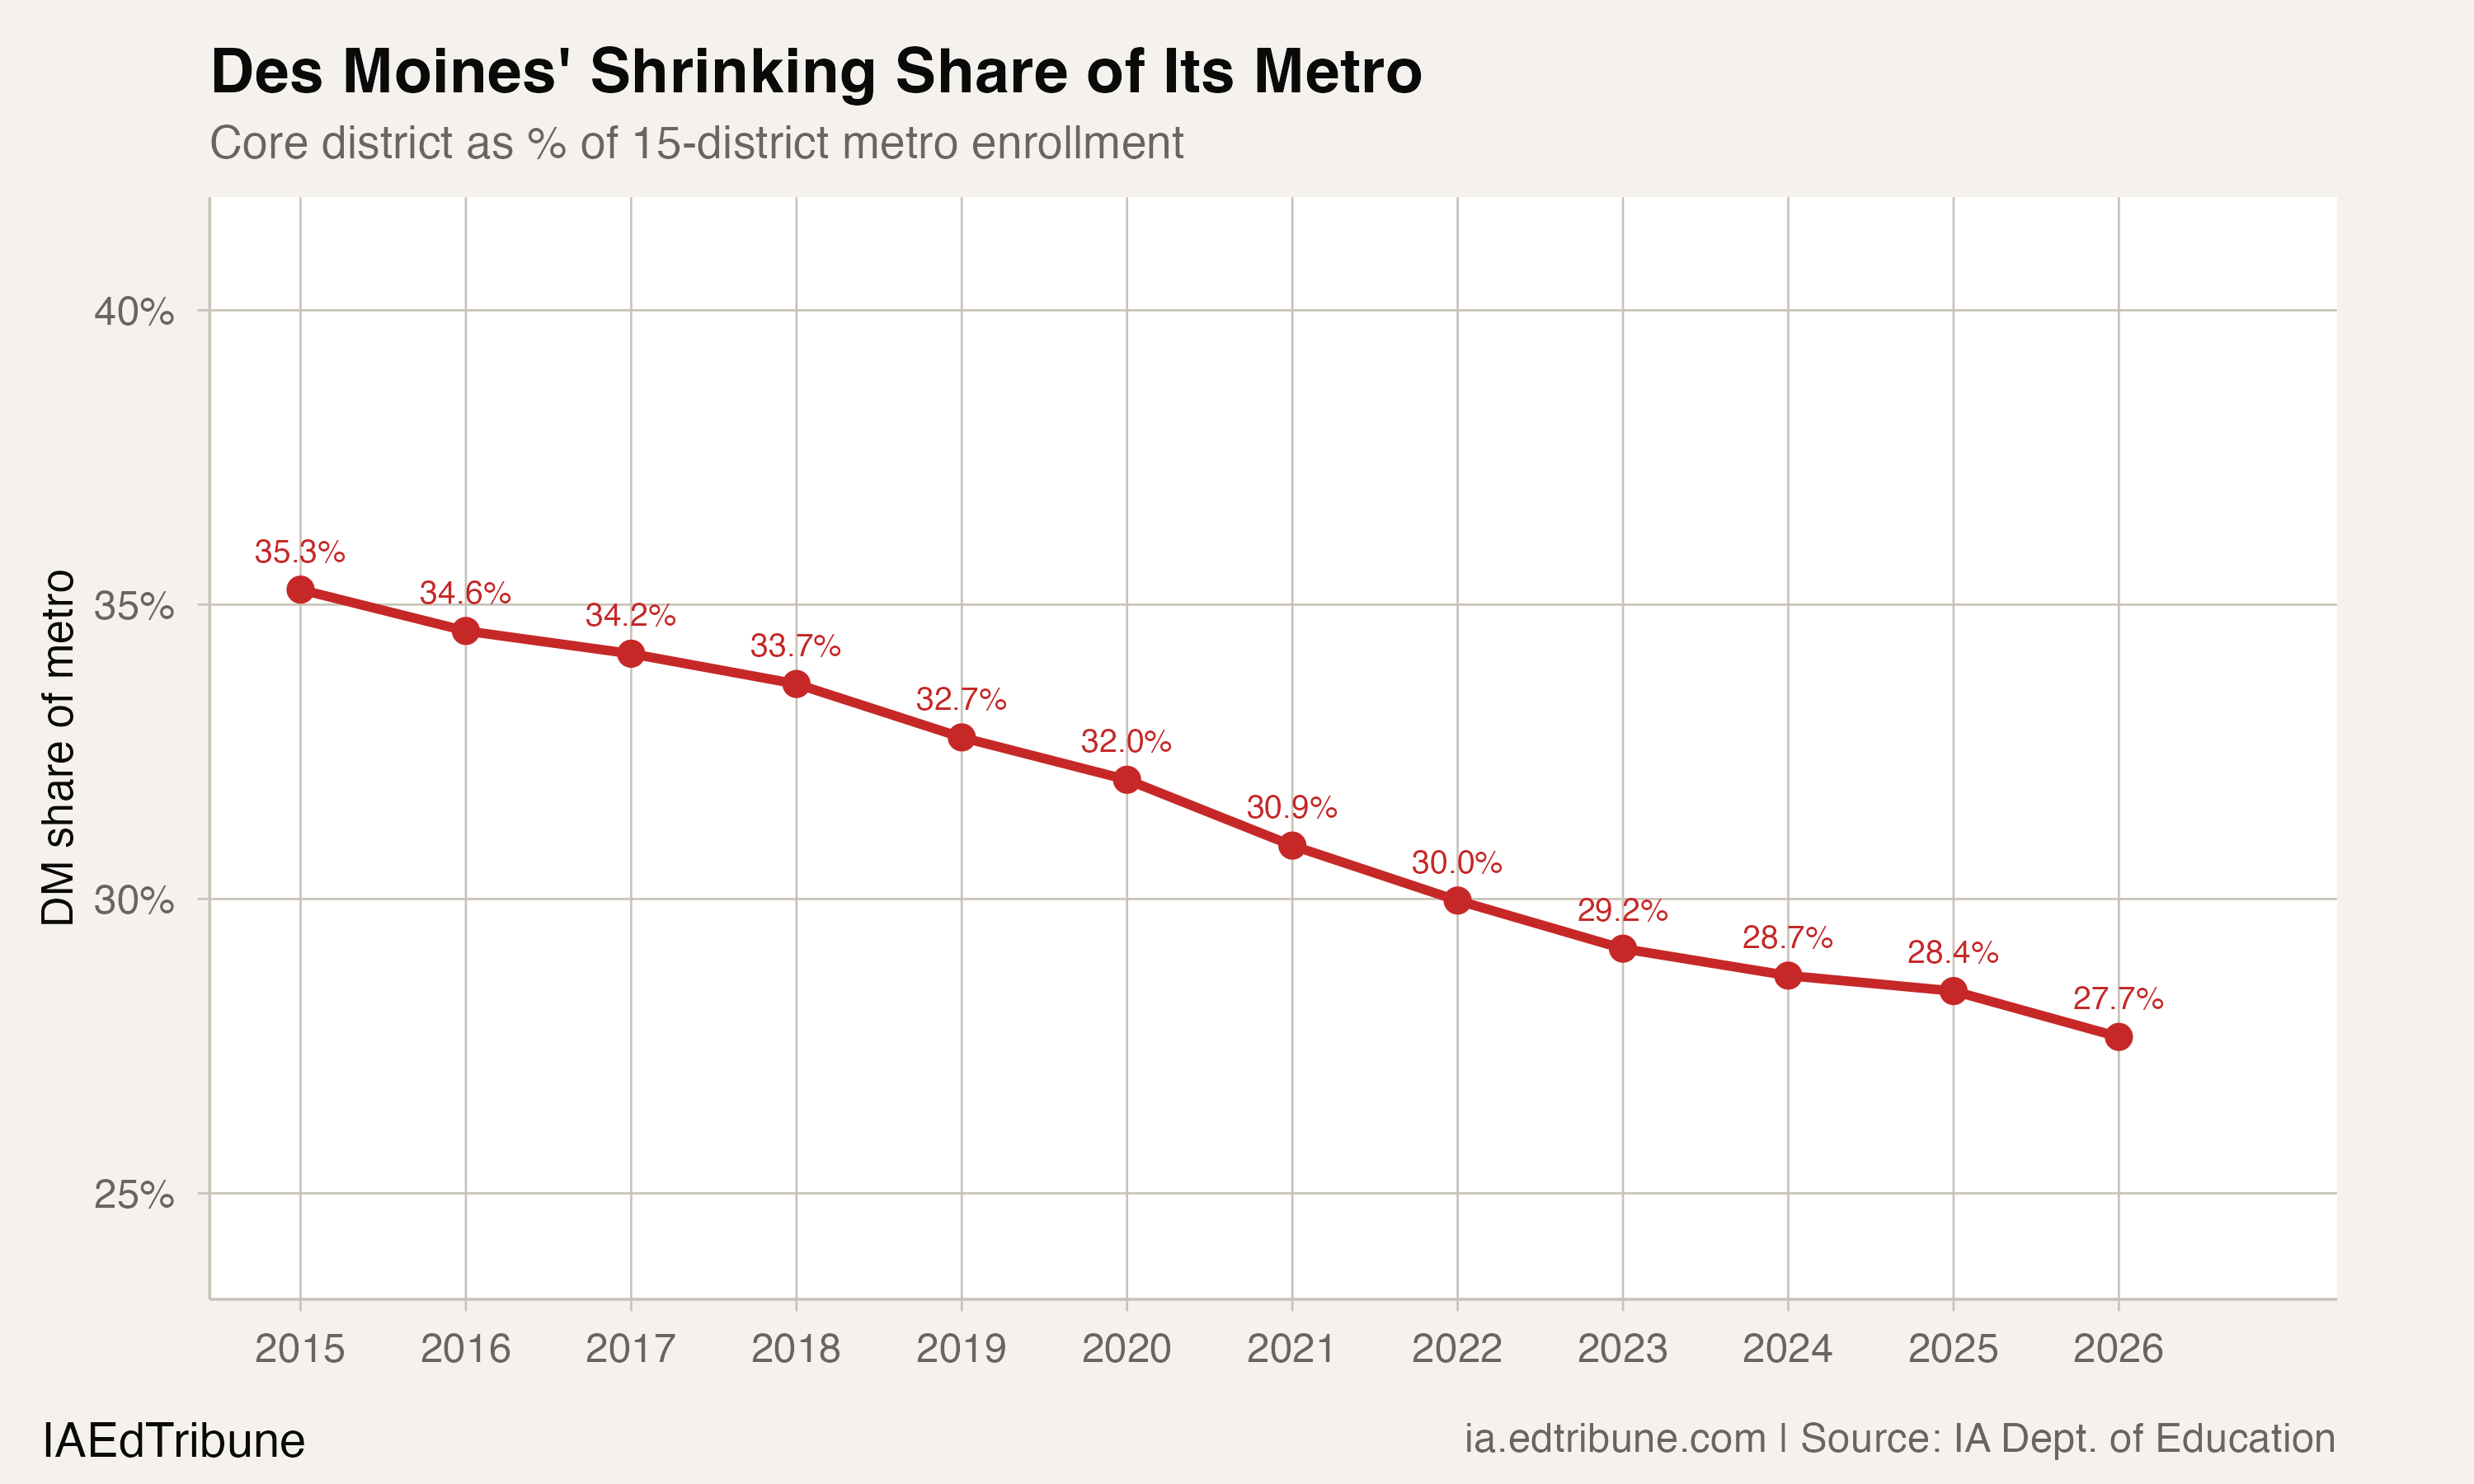
Des Moines' share of the metro has fallen from 35.3% to 27.7% since 2015. A district that once enrolled more than a third of the metro's students now enrolls barely more than a quarter.
The suburban boom has a zip code
Not every suburb grew equally. The fastest growth concentrated in Dallas County, west of Des Moines, which the U.S. Census Bureau identified as the fastest-growing county in Iowa and one of the fastest in the nation, with a population that increased more than 50% since 2010. Waukee, entirely within Dallas County, grew from roughly 14,000 residents to nearly 24,000 in the 2020 census alone, with a 2024 special census putting the city at 31,823.
That population explosion required infrastructure to match. The district opened a second high school, Waukee Northwest, in 2021, a $120 million facility built to absorb the growth.
The growth belt extends beyond Waukee. Van Meter (+73.5%), Bondurant-Farrar (+53.3%), North Polk (+49.6%), and Adel DeSoto Minburn (+37.7%) all grew faster than 35% over the period. Even the larger suburbs posted gains: Ankeny added 2,098 students (+19.8%), and Southeast Polk added 613 (+8.9%).
The exceptions prove the donut pattern. West Des Moines, the second-largest suburb, lost 633 students (-6.7%), and Indianola lost 120 (-3.3%). Both are older, more established suburbs without the new residential construction driving growth on the metro's western and northern edges.
Multiple forces, not a single explanation
Des Moines' losses cannot be attributed to any single cause, though several mechanisms are operating simultaneously.
The most direct factor is Iowa's Education Savings Account program, which expanded to universal eligibility for all K-12 students in 2025-26. The program provides $7,988 per student for private school tuition, and participation has grown rapidly: 27,866 students statewide used ESAs in 2024-25, up from 16,757 the prior year. DMPS school board chairperson Kim Martorano told Axios Des Moines that state law changes, including ESAs, charter school expansion, and open enrollment rule changes, are contributing to enrollment loss. The district reported 3,121 students living within DMPS boundaries used ESAs in 2025-26, up from 2,242 the year before.
Statewide, though, the ESA program's direct impact on public-to-private switching may be smaller than its growth suggests. Of the 27,866 ESA recipients in 2024-25, only about 1,905, or 6.8%, had attended Iowa public schools the previous year. Most were students who were already in private schools or entering kindergarten.
Open enrollment is another factor. More than 43,000 Iowa students, roughly 9% of public enrollment, attend districts outside their home boundaries. The data does not break out how many are transferring from Des Moines specifically to suburban districts, but the directional pressure is clear in the enrollment figures: the metro's total enrollment is growing while its core is shrinking.
The third mechanism is residential sorting. Dallas County's population boom is driven by new housing construction drawing young families who would have considered Des Moines a generation ago. These families are choosing Waukee or Ankeny or Bondurant-Farrar before their children ever enroll in a Des Moines school. This is not a "transfer" that shows up in open enrollment data. It is a choice made at the moving-truck stage.
Two districts, two demographics
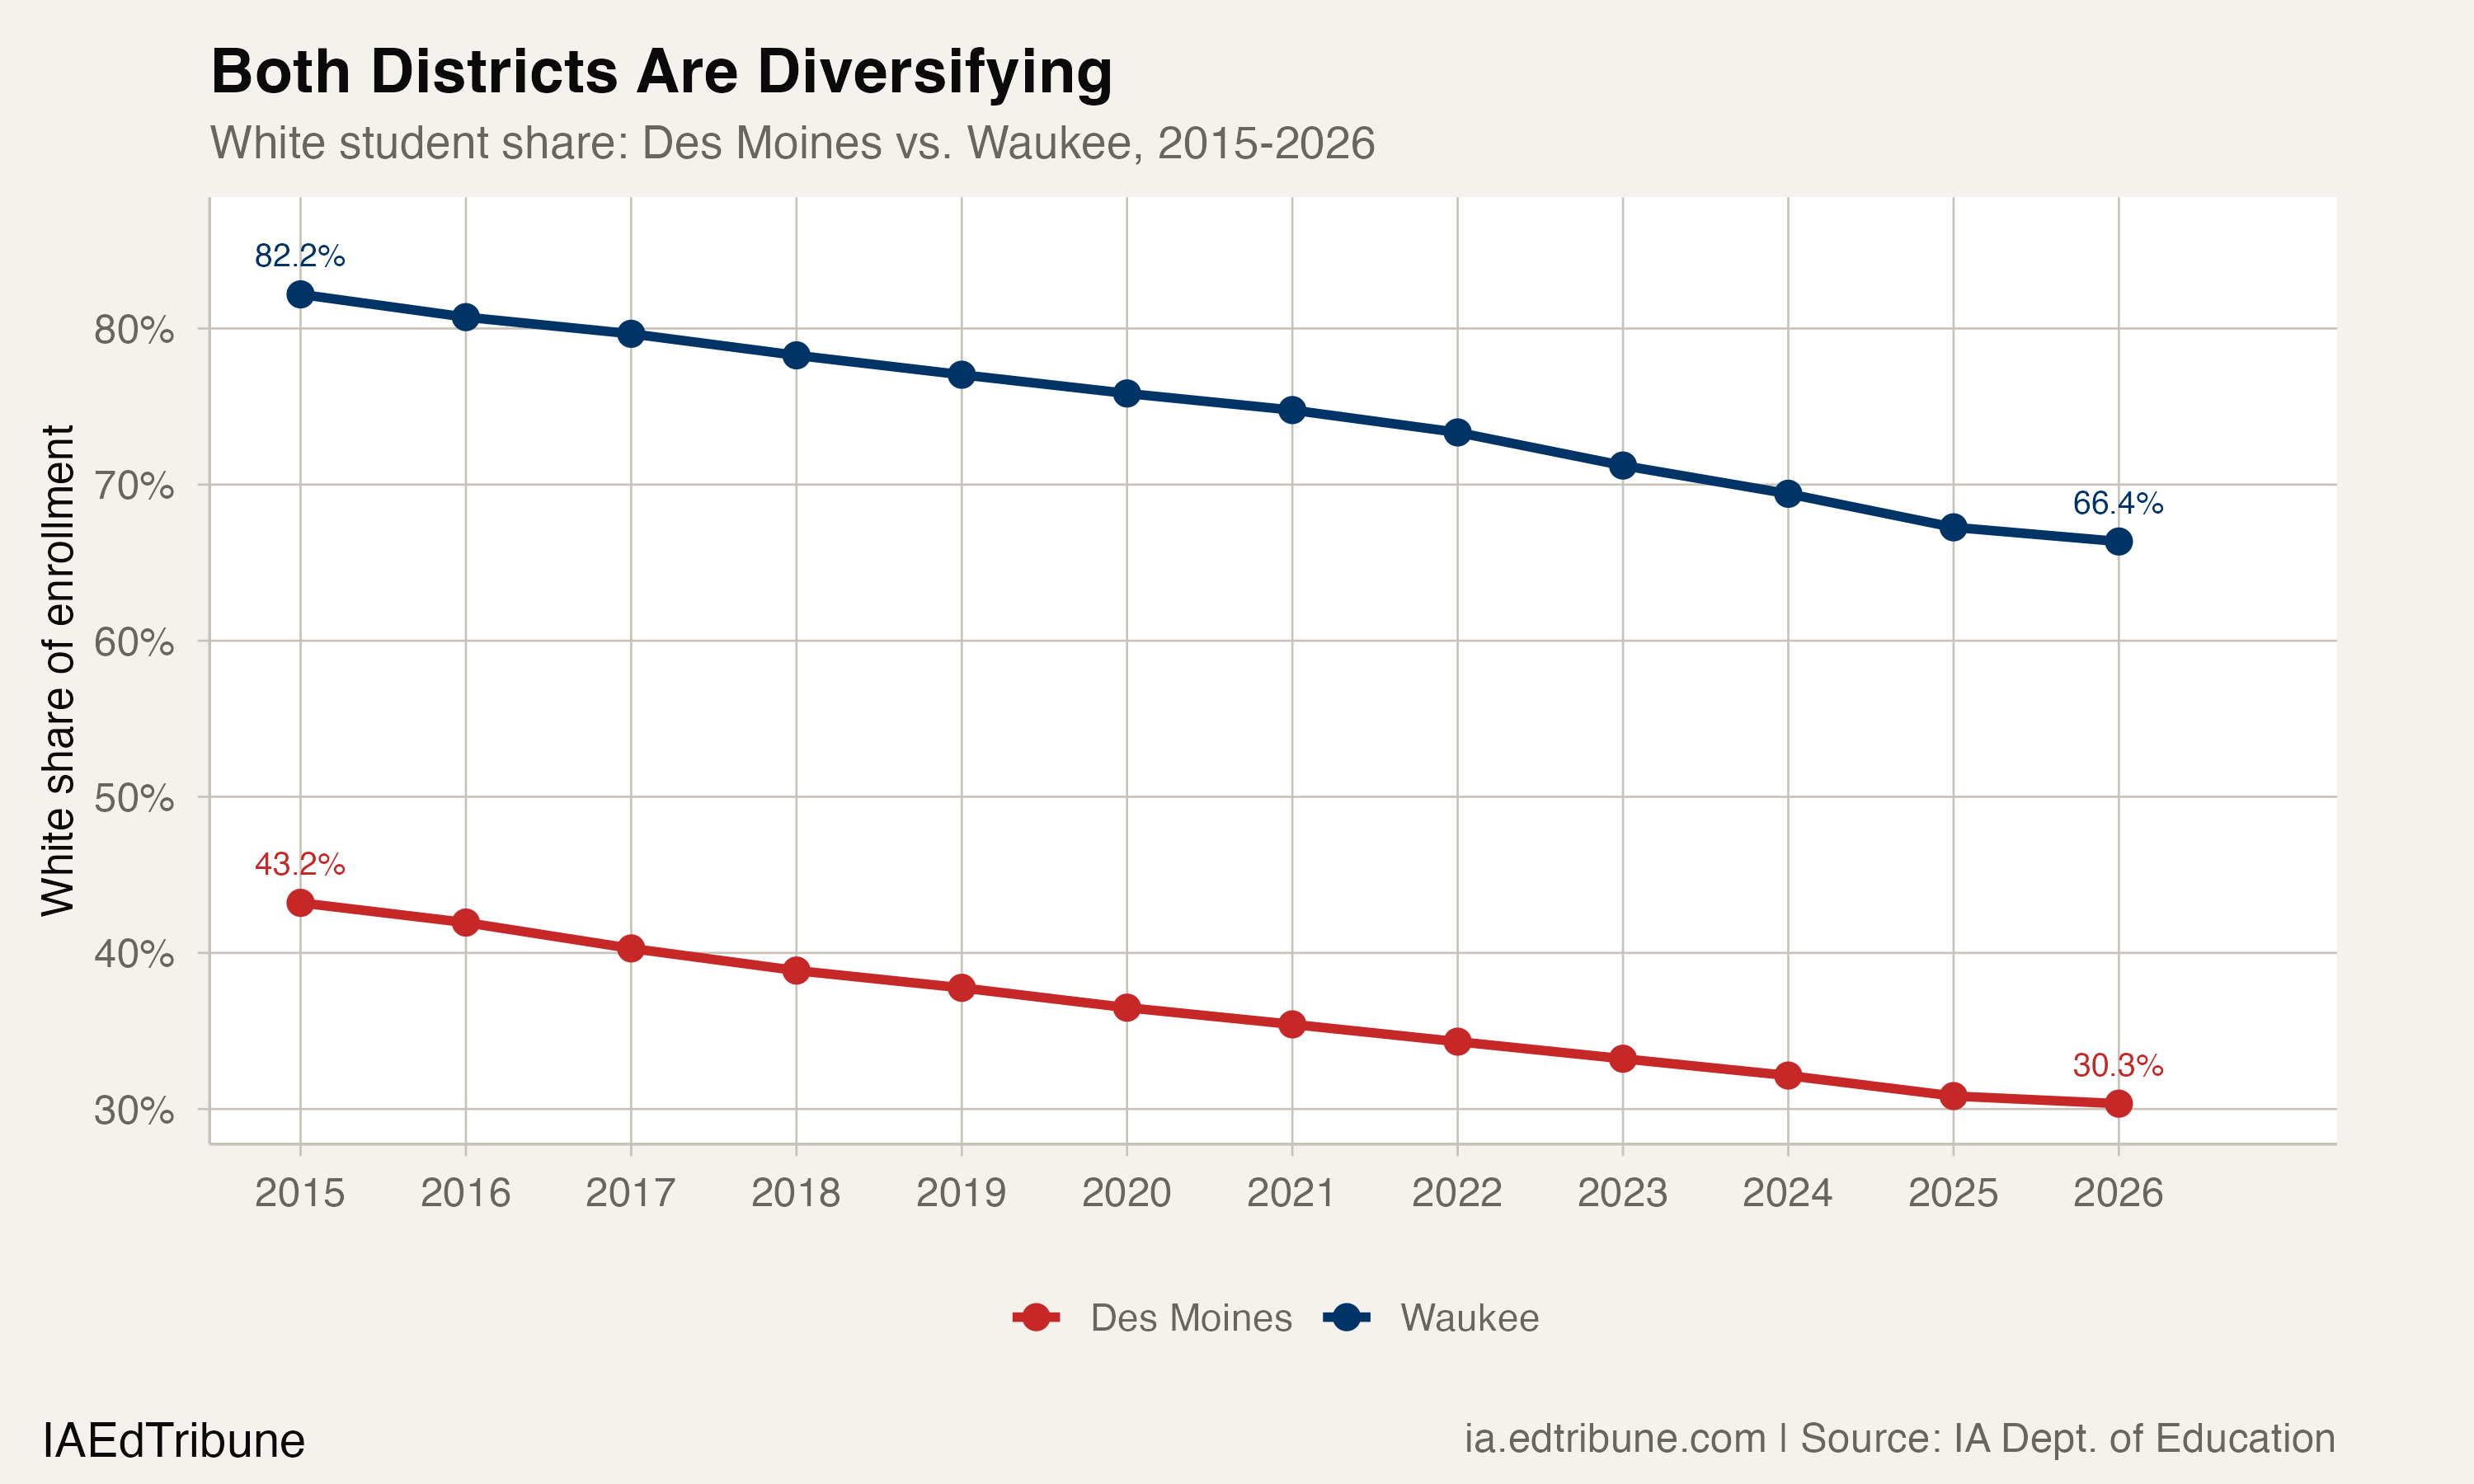
The donut effect carries a demographic dimension. Des Moines' white student share fell from 43.2% in 2015 to 30.3% in 2026, a 12.9 percentage-point drop driven by the loss of 5,727 white students. Hispanic enrollment, by contrast, grew by 1,229 students, pushing its share from 24.4% to 32.6%. Black enrollment held roughly steady in absolute terms (6,008 to 6,381) but its share rose from 17.9% to 22.1% as the total shrank.
Waukee is diversifying too, though from a very different starting point. Its white share dropped from 82.2% to 66.4%, but that decline reflects the composition of new arrivals rather than the departure of white families. Waukee added 2,376 white students alongside 1,104 Black students, 796 Hispanic students, 642 Asian students, and 714 multiracial students. Every racial group grew in absolute terms.
The contrast matters for how the two districts experience the same regional dynamic. Des Moines is becoming more diverse in part because white families are leaving. Waukee is becoming more diverse because non-white families are arriving. The demographic trajectory looks similar on a chart, but the budgetary and programmatic implications differ substantially.
The limits of enrollment data
Enrollment files show where students are. They do not show why. A family that left Des Moines for Waukee's test scores looks identical in the data to one that moved to Dallas County for a cheaper house. Des Moines reports 3,121 students within its boundaries using ESAs in 2025-26, but a Princeton study of the 2023 ESA cohort found nearly two-thirds of recipients had already been in private school.
The fiscal consequences are clearer. Des Moines passed a $265 million bond in November 2025 with 74% voter support for its "Reimagining Education" plan — signature schools, expanded preschool, redesigned middle schools. A bet that differentiated programs can slow the outflow. Waukee is building schools as fast as it can to absorb the inflow.
The statewide picture
The Des Moines donut effect is the most pronounced example of a pattern visible across Iowa's urban areas. Cedar Rapids fell from the state's second-largest district to third, losing 2,107 students (-12.6%). Davenport dropped from third to sixth, shedding 3,325 students (-20.5%). Iowa statewide lost 9,719 students (-1.9%) over the period, but the Des Moines metro gained 9,329. The 15-district metro now accounts for 21.0% of the state's enrollment, up from 18.8% in 2015.
The question for Des Moines is whether Reimagining Education can reverse an eight-year decline in a policy environment that increasingly subsidizes alternatives. The question for Waukee is whether a district that grew by 400 to 650 students per year for a decade can sustain the infrastructure spending that growth demands. Both districts face structural pressures. They are just mirror images of each other.
Detailed code that reproduces the analysis and figures in this article is available exclusively to EdTribune subscribers.
Discussion
Sign in to join the discussion.
Loading comments...