In this series: Iowa 2025-26 Enrollment.
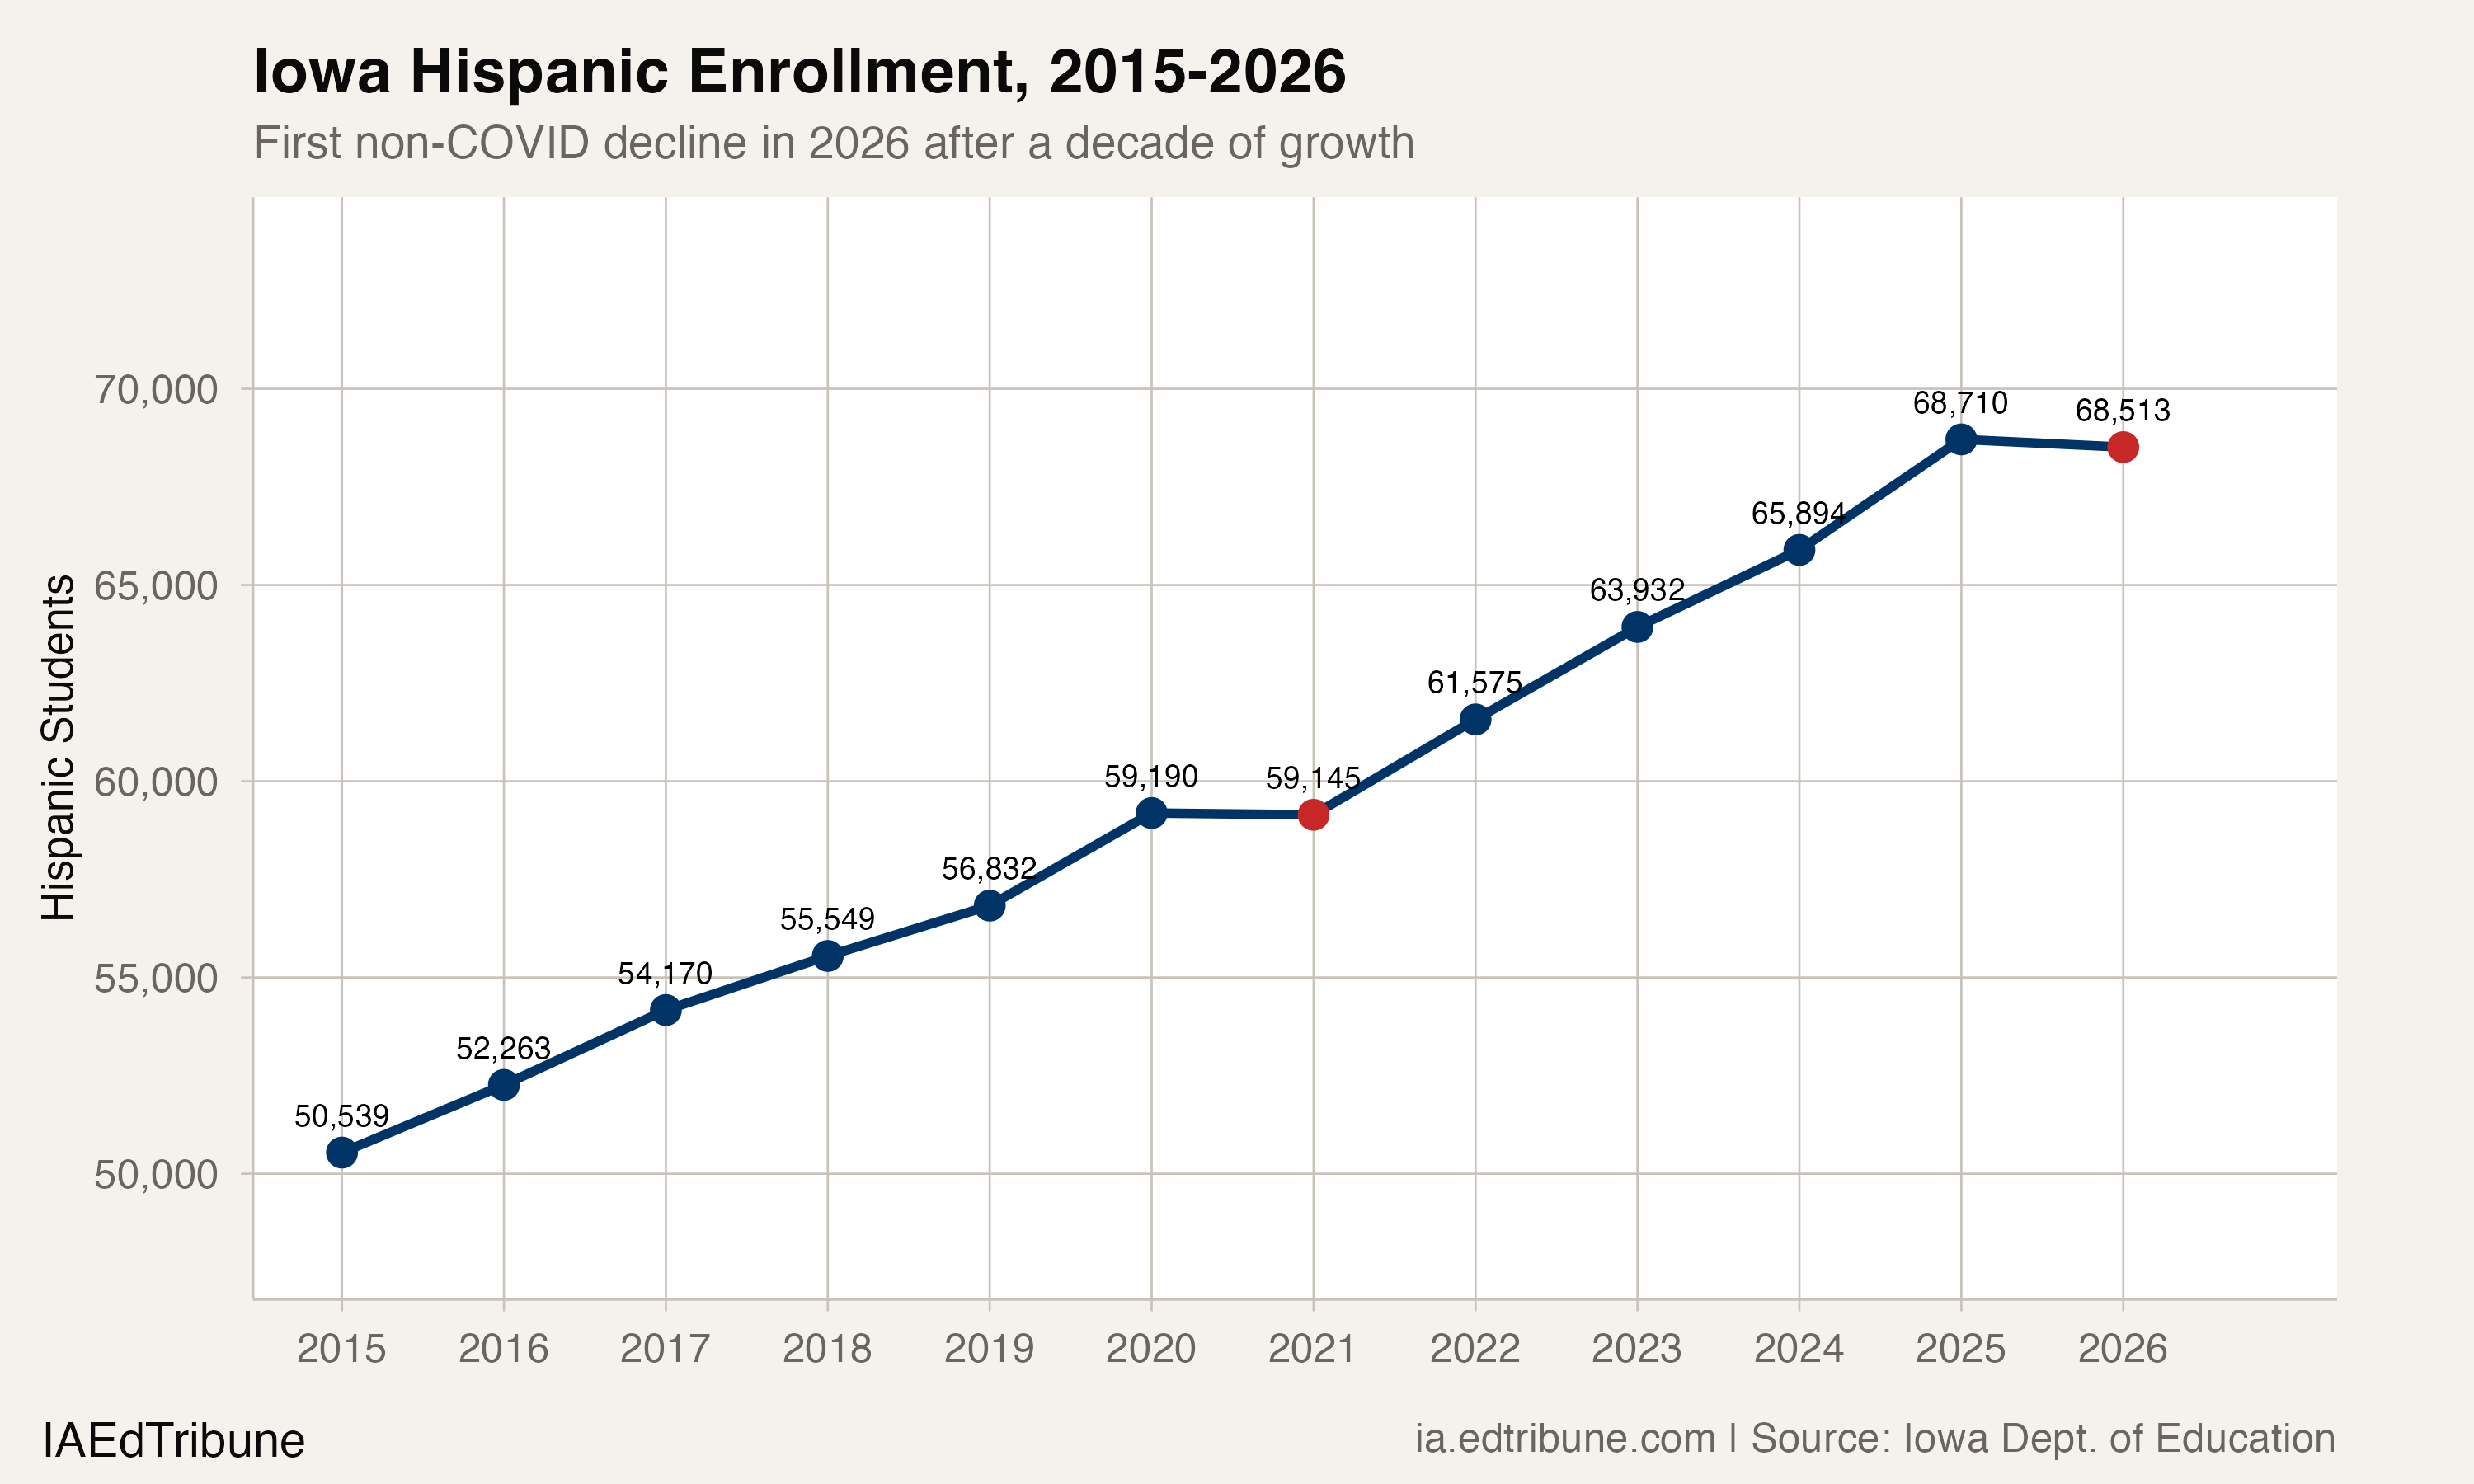
For 10 years, Hispanic enrollment was the one line on Iowa's enrollment chart that always went up. While white enrollment fell by 49,582 students between 2015 and 2026, Hispanic growth added 17,974 over the same span, offsetting roughly a third of the loss in most years and keeping the state's total decline manageable. In 2025, Hispanic enrollment hit a record 68,710 after gaining 2,816 students in a single year.
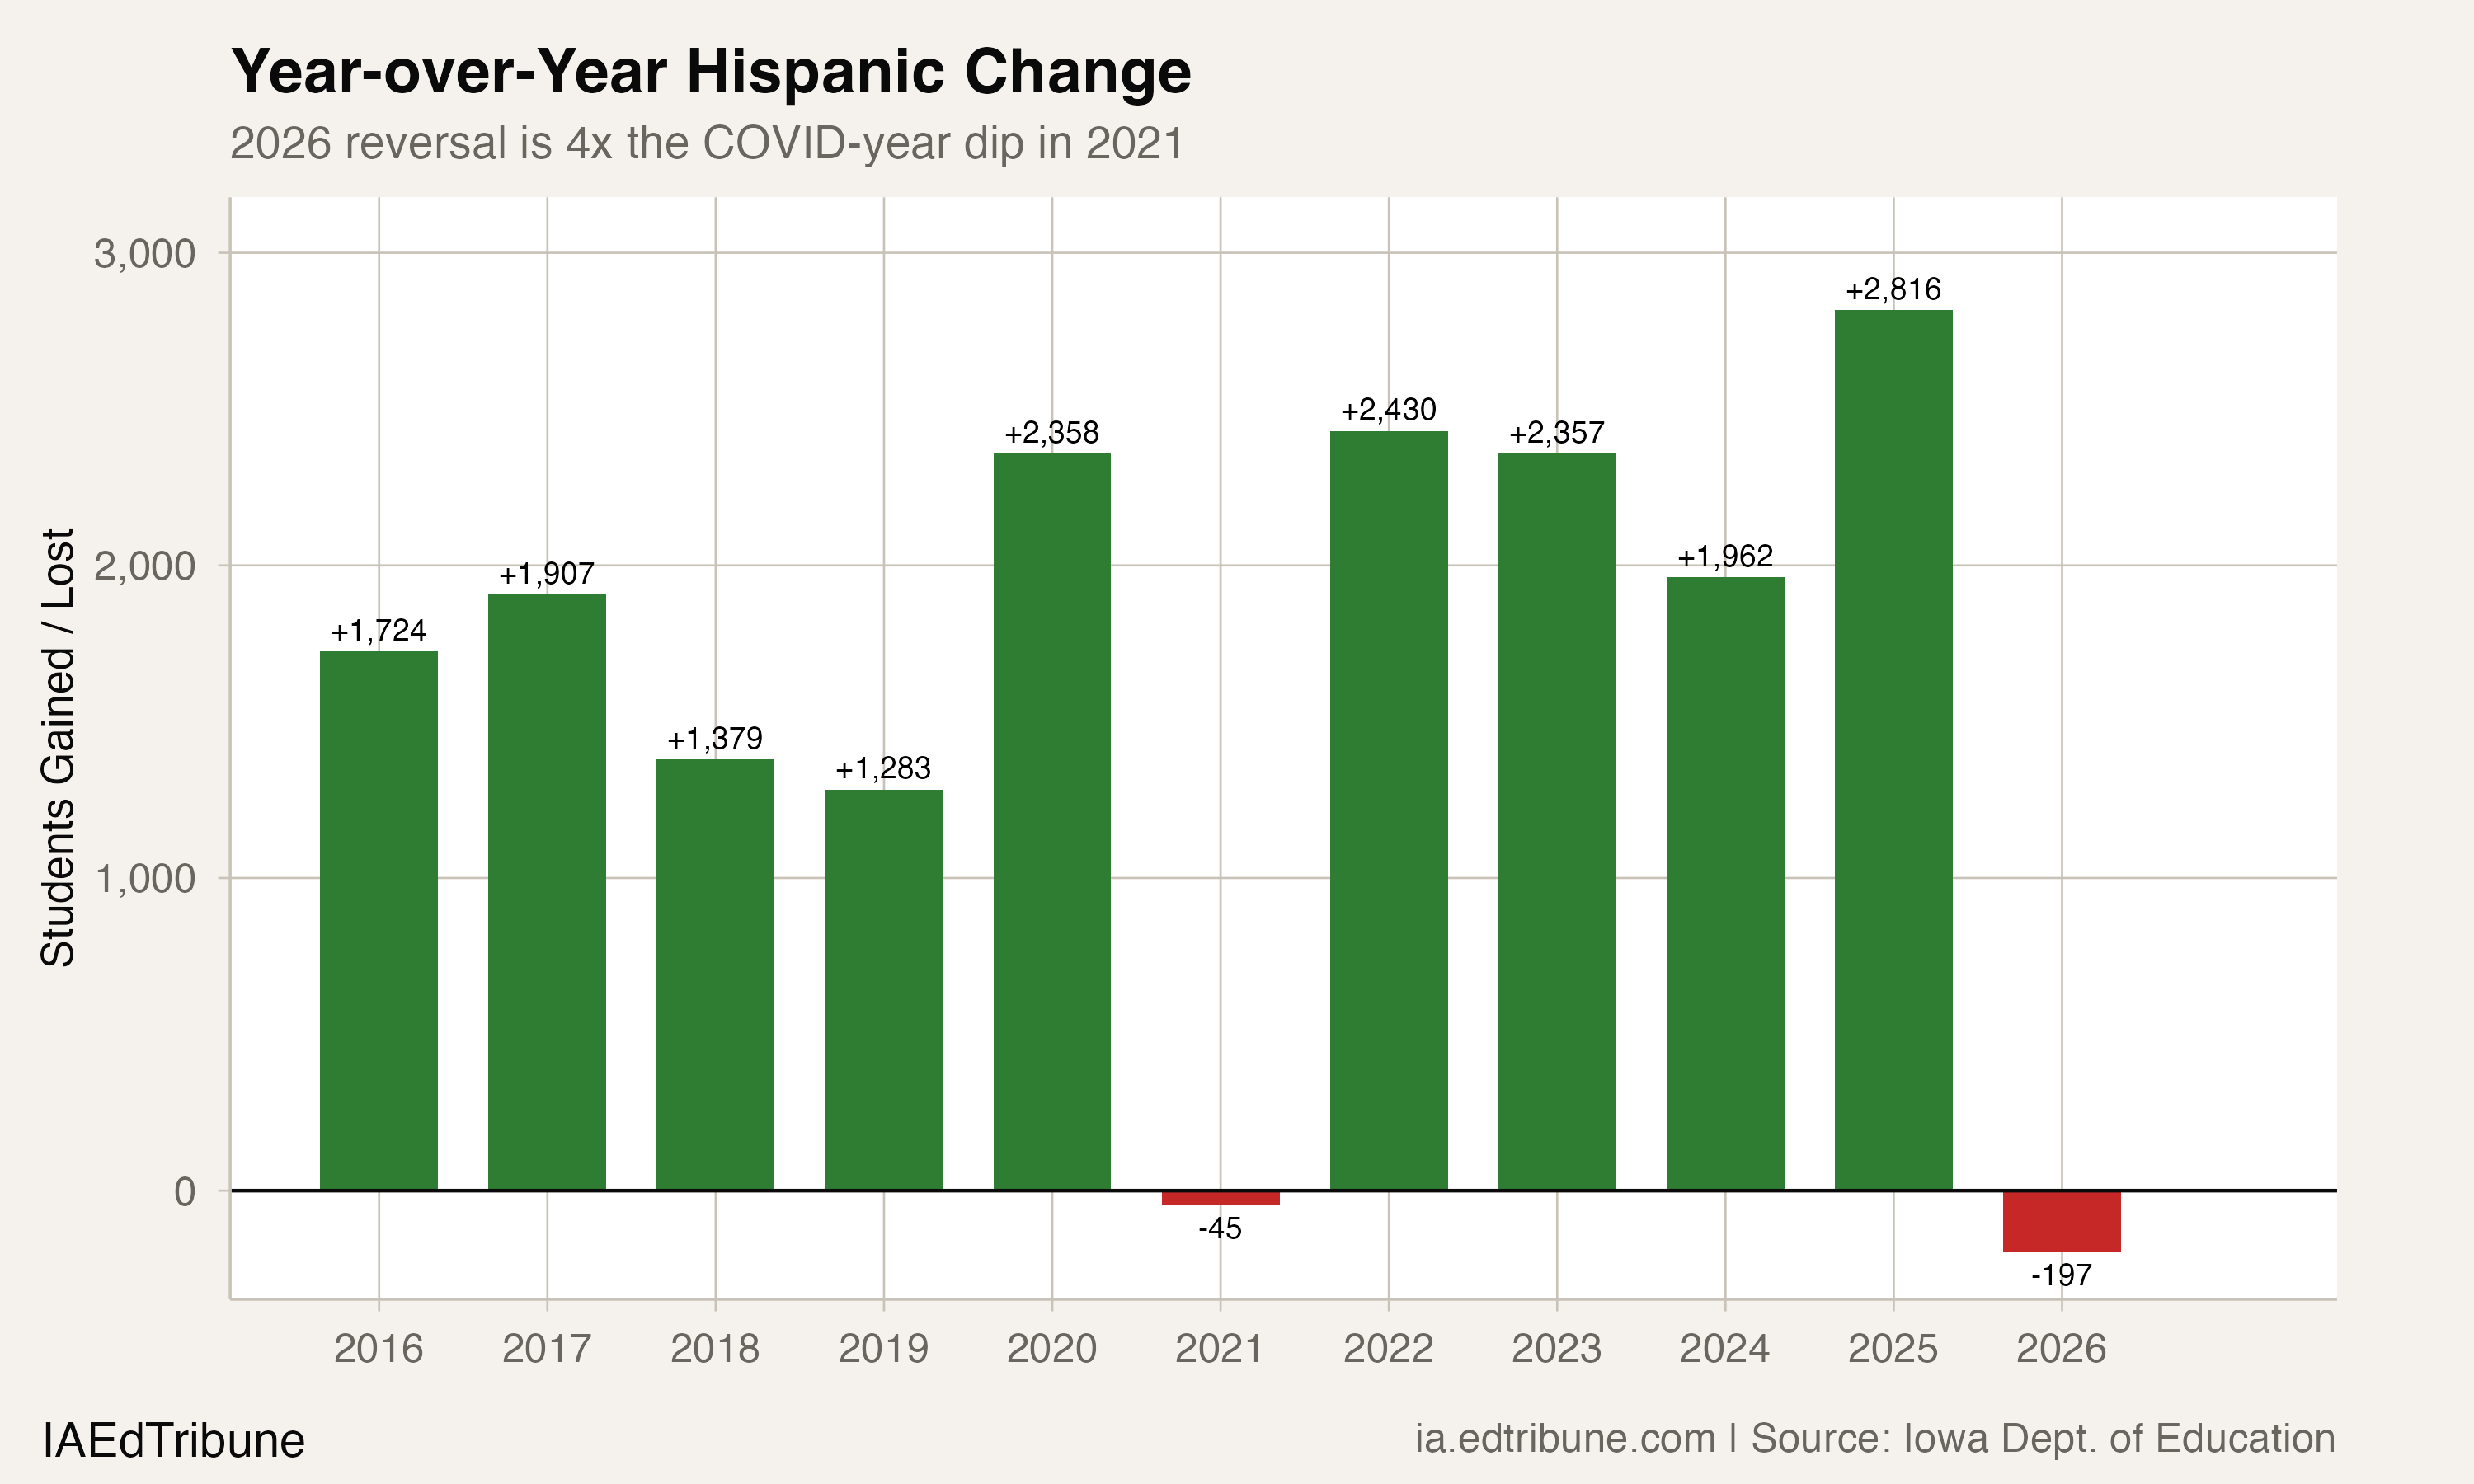
In 2026, that line bent downward. Hispanic enrollment fell to 68,513, a loss of 197 students, or 0.3%. It is the first non-COVID decline in the dataset. The only other dip was 45 students during the pandemic disruption of 2021, which immediately reversed into a gain of 2,430 the following year. The 2026 drop is more than four times larger.
The stabilizer that stopped stabilizing
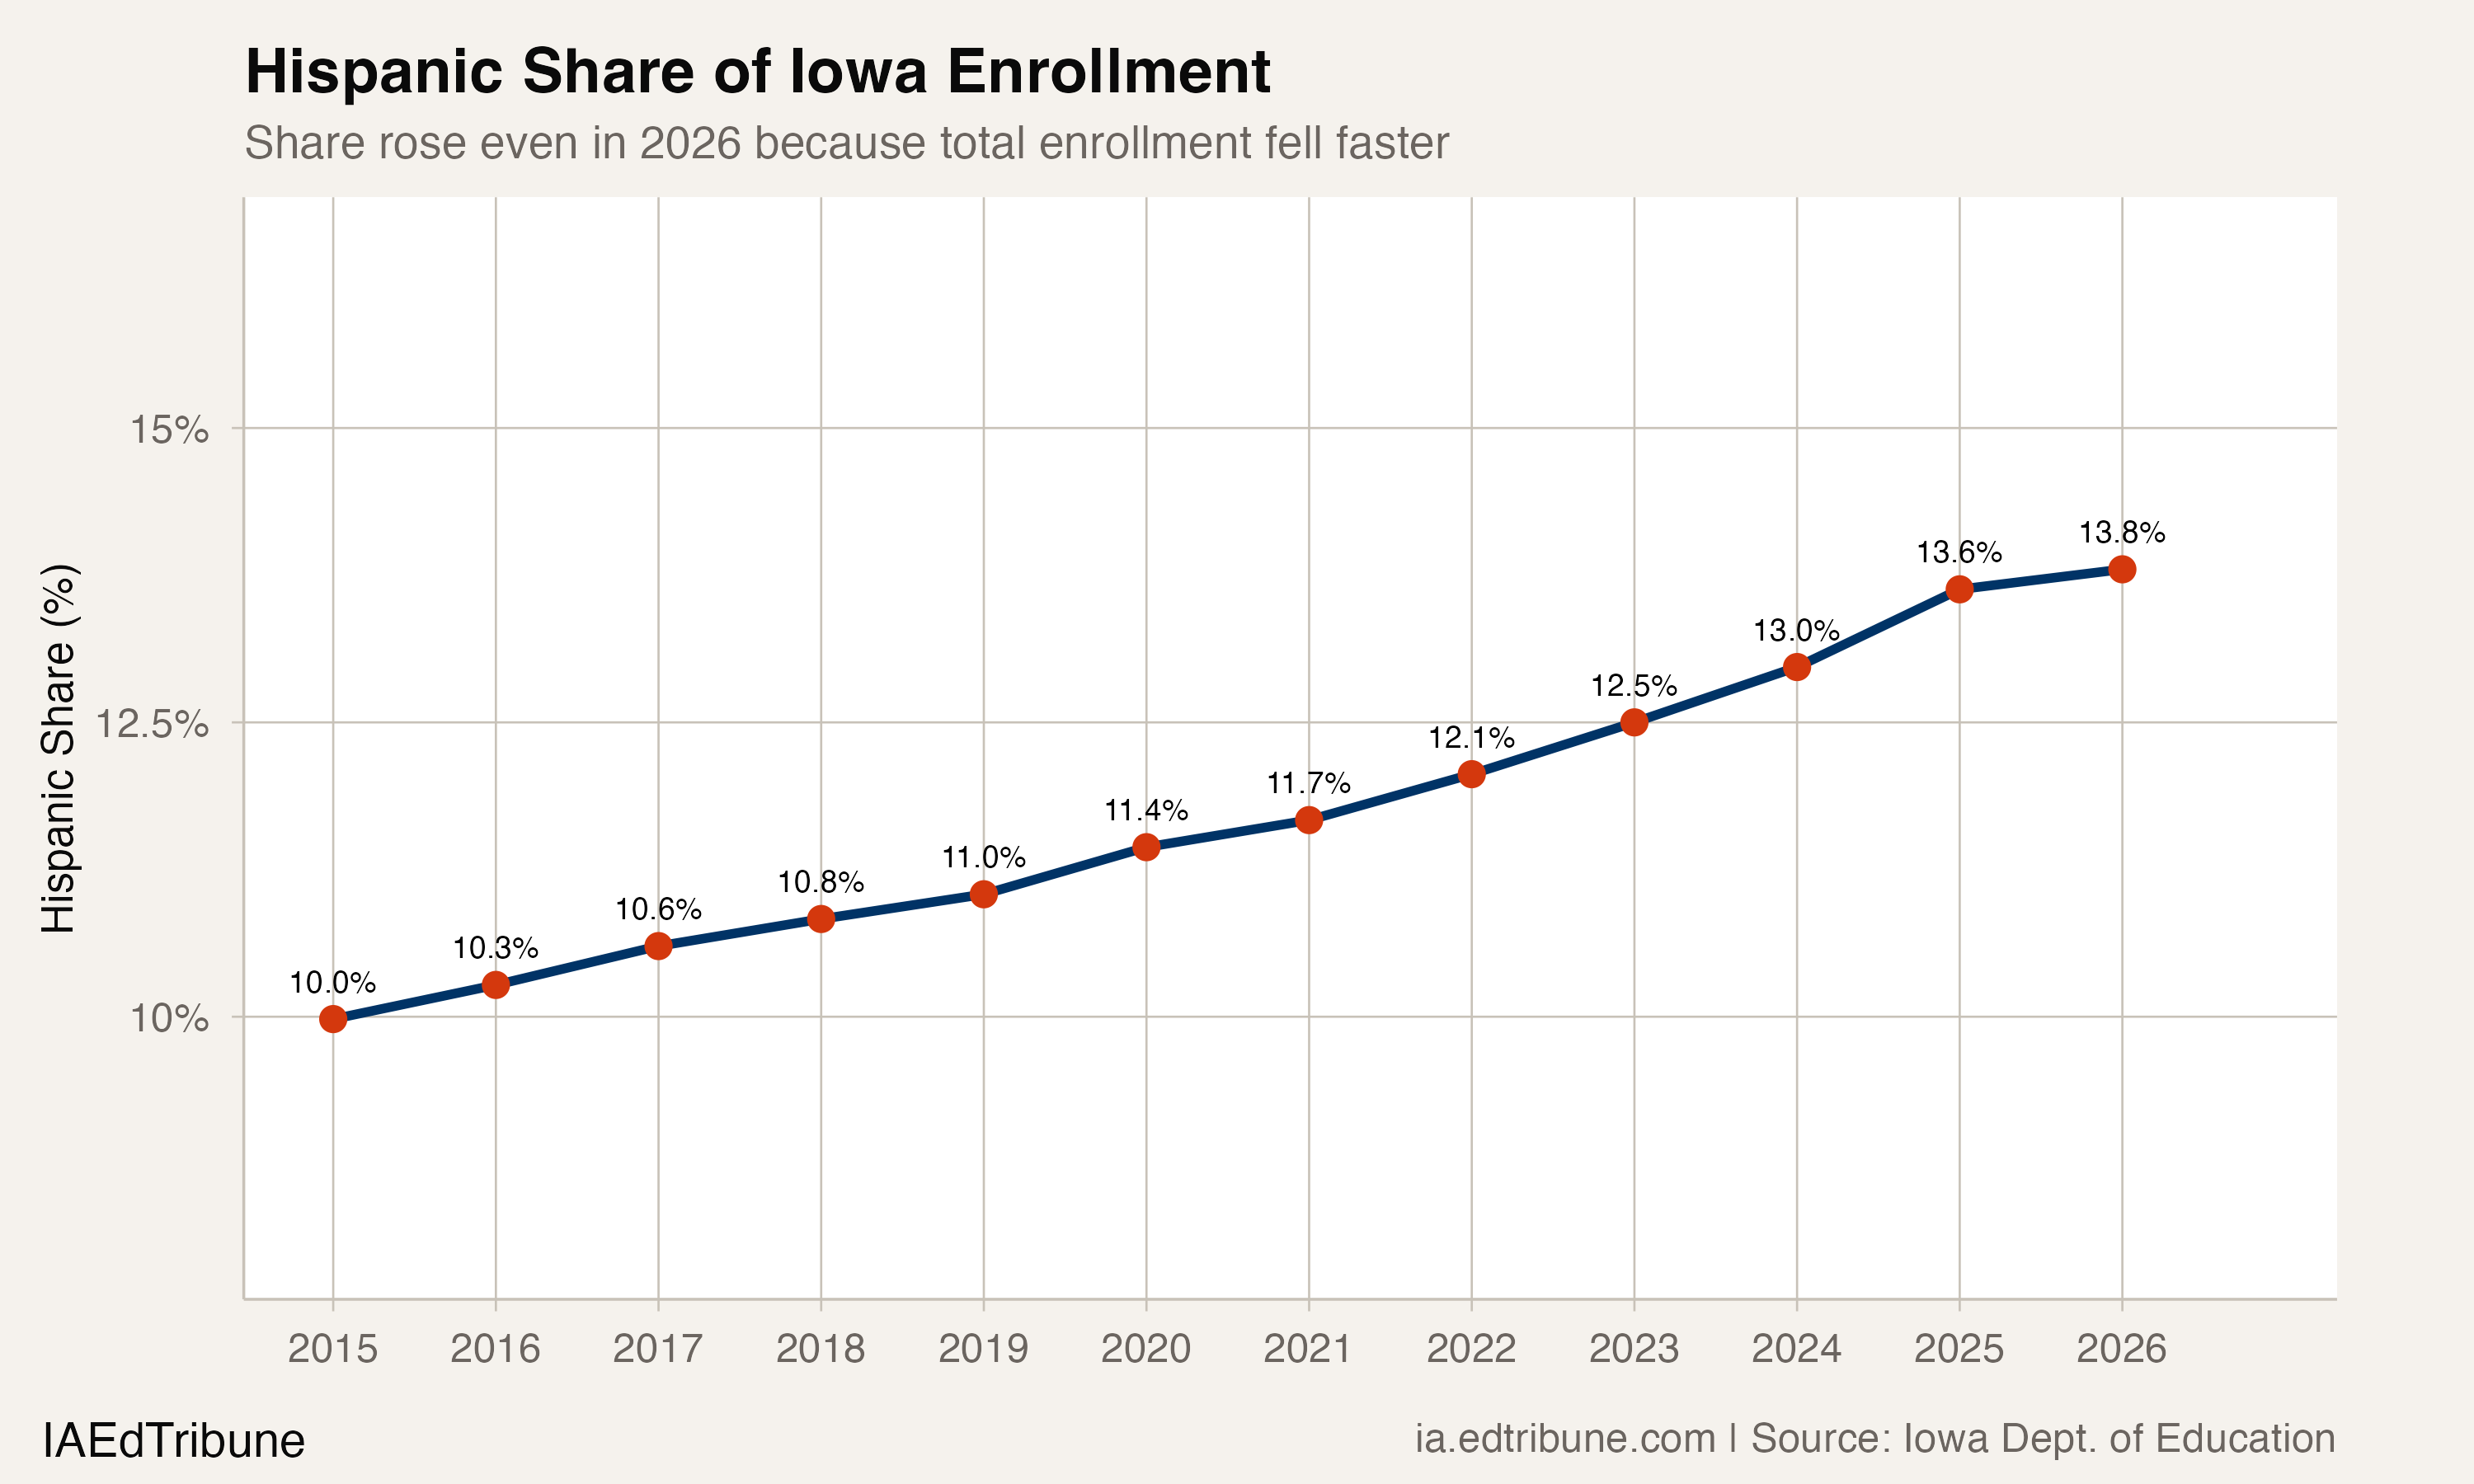
The structural role of Hispanic enrollment in Iowa is more important than the raw number suggests. At 13.8% of total enrollment, Hispanic students are the state's second-largest racial group, but their function in the enrollment equation has been disproportionate. Between 2016 and 2020, Hispanic growth offset an average of 81% of annual white losses. Between 2022 and 2025, it offset 28% to 360%, depending on the year.
In 2026, the offset disappeared. White enrollment fell by 8,415 students. Hispanic enrollment fell by 197. For the first time, both groups shrank simultaneously. The result: Iowa lost 7,670 students, its worst non-COVID year and more than double the 3,820 it lost in 2025.
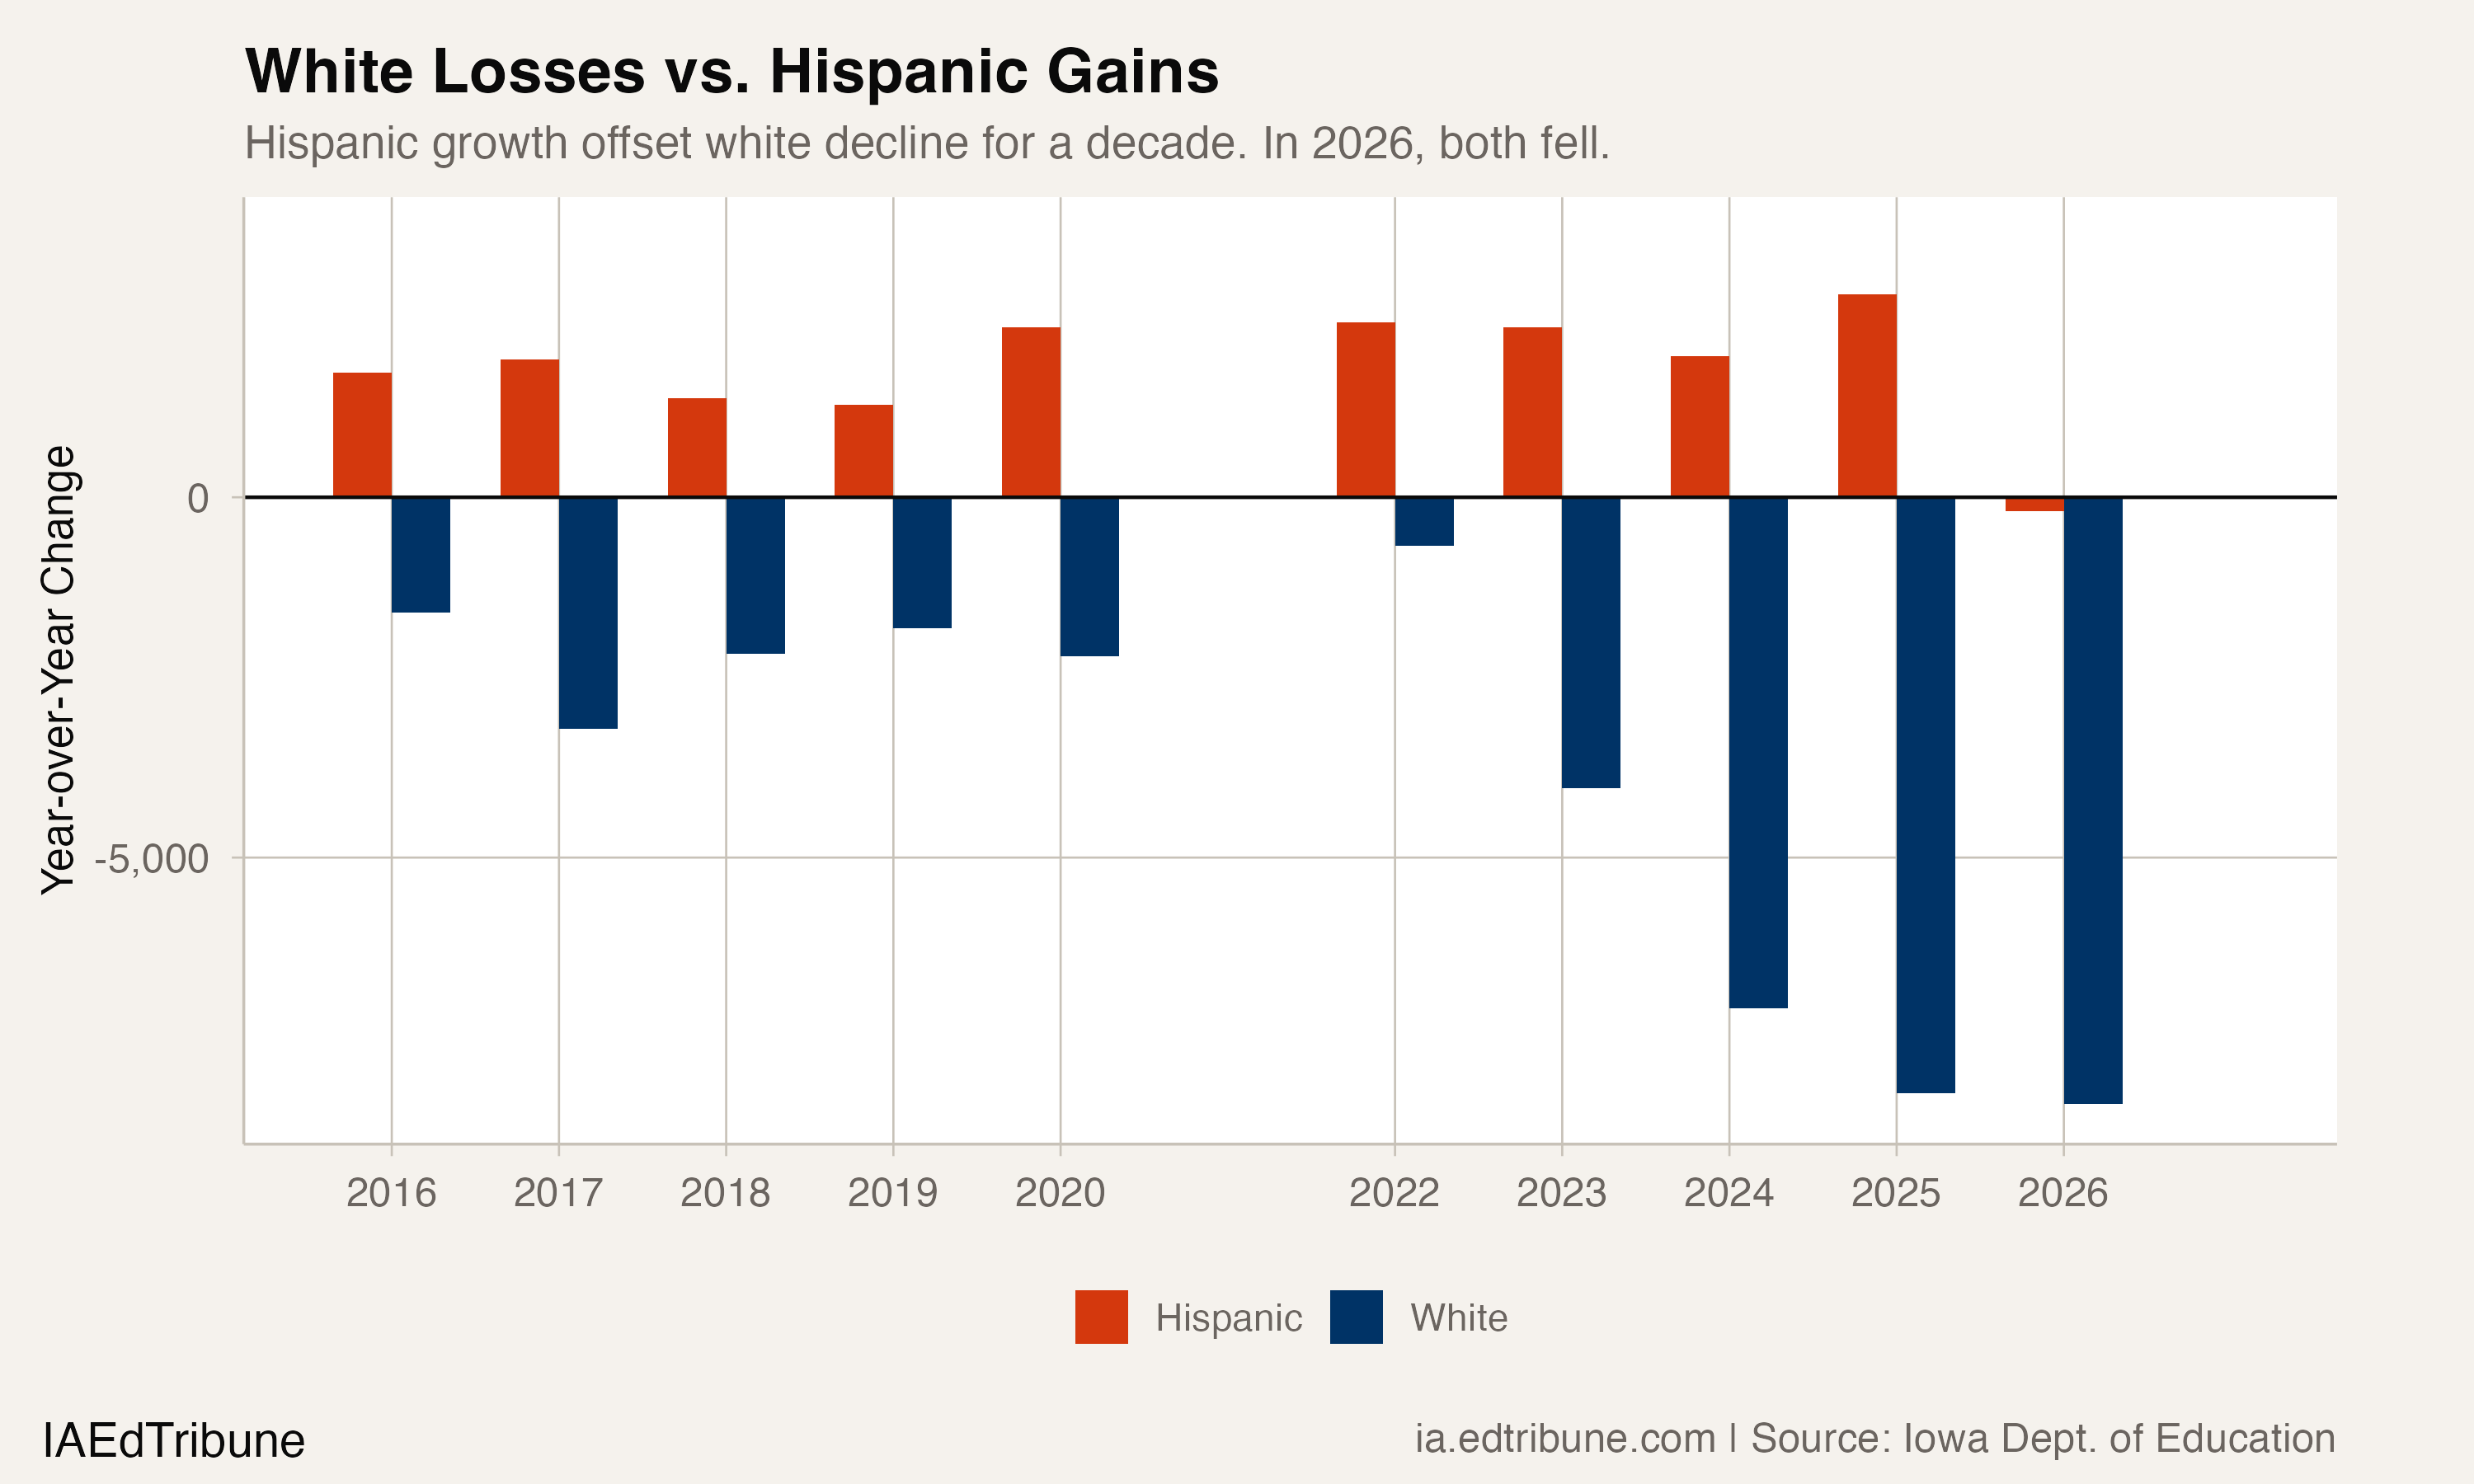
The timing matters because white losses are accelerating. Iowa lost 1,601 white students in 2016. It lost 8,415 in 2026. Without Hispanic growth as a partial counterweight, the decline curve steepens considerably.
Where the losses concentrated
Des Moines↗ET lost 317 Hispanic students, more than the entire statewide net loss of 197. The state's largest district has the largest Hispanic student population (9,425 in 2026, 32.6% of district enrollment), and its decline alone accounted for 161% of the statewide drop. Other districts' gains partially netted out Des Moines' loss, but not enough.
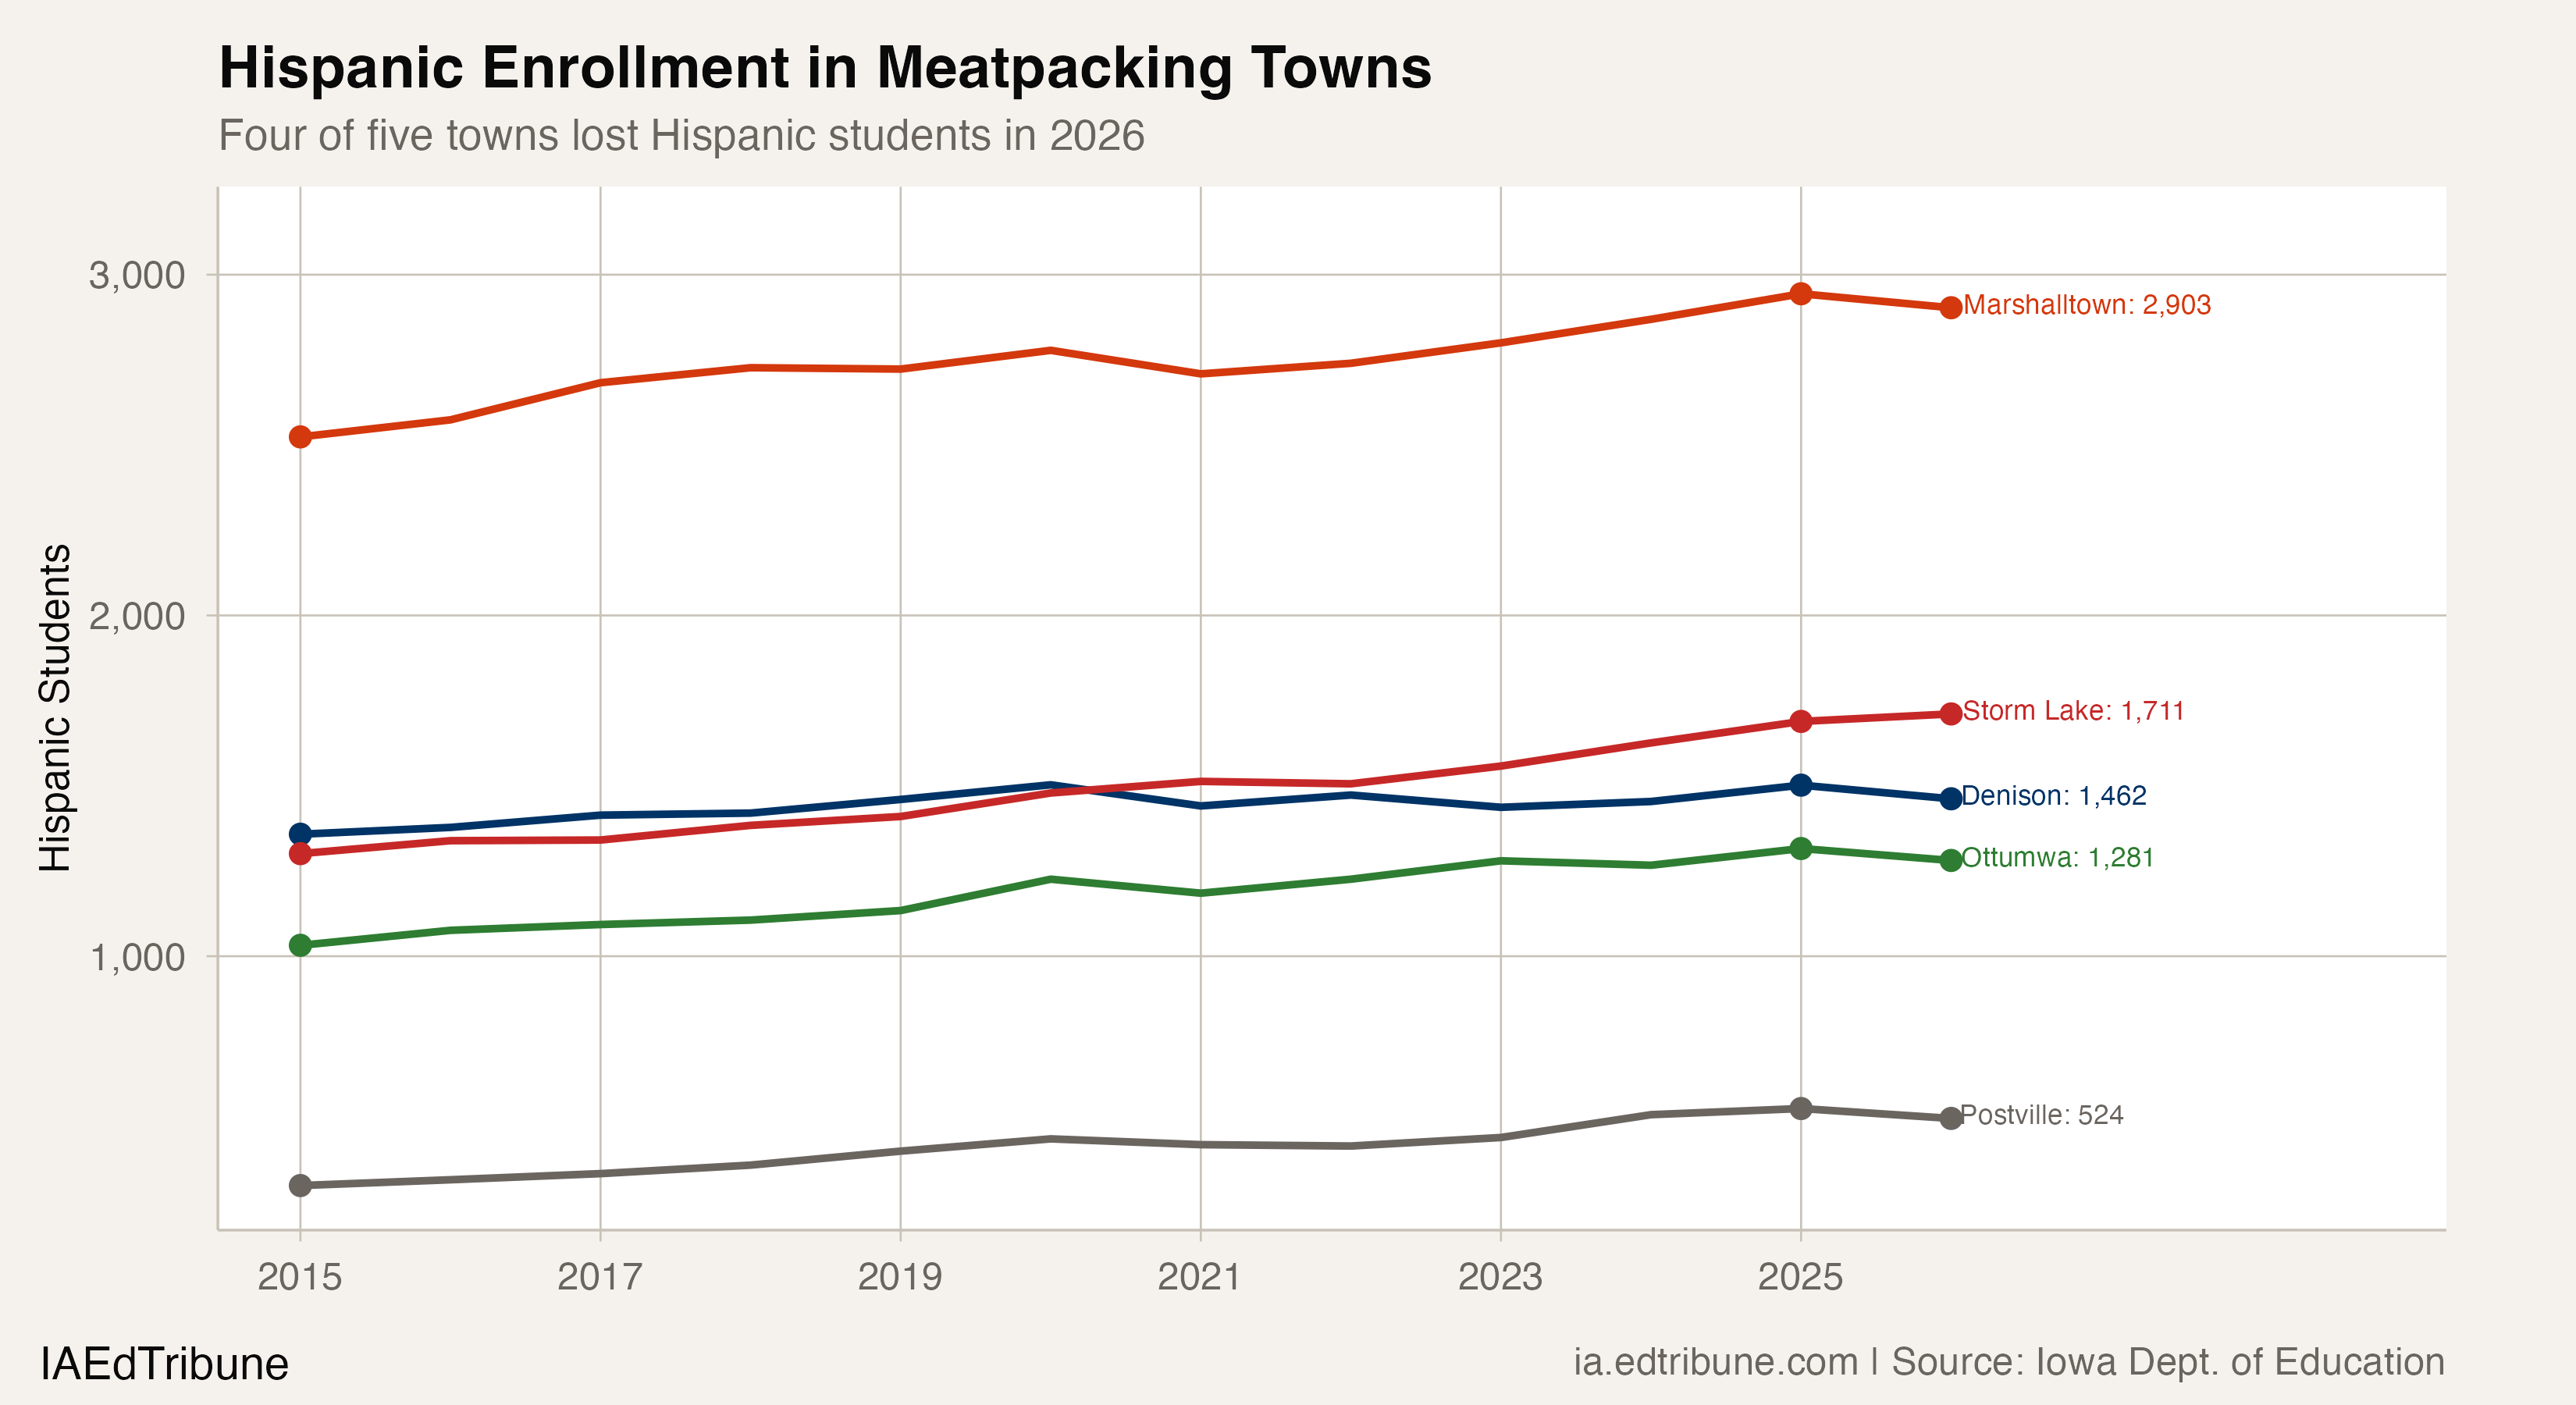
The pattern extended into Iowa's meatpacking corridor, the chain of small towns where Hispanic families have sustained schools that would otherwise have emptied. Marshalltown↗ET (56.3% Hispanic) lost 41 students. Denison↗ET (65.2% Hispanic) lost 40. Ottumwa↗ET lost 35. Postville (74.8% Hispanic) lost 29.
But the causes are not uniform across towns. Brendan Knudtson, the superintendent at Postville↗ET, said Postville's drop had nothing to do with immigration enforcement. The class of 2025, he said, was "historically one of, if not the largest, class over the years, peaking at 74 students," followed by another outsized class of 62. Two unusually large graduating classes leaving back-to-back created a one-year dip that the data cannot distinguish from a policy-driven departure.
Knudtson confirmed that immigration does shape Postville's enrollment over time. "Our enrollment at times is affected by immigration policy," he said. "COVID and the halt on refugees affected us, and three years ago we saw a large summer increase due to the changes in how family units were handled at the border." In an October 2025 interview with Iowa Public Radio, he put it more bluntly: without immigration, Postville would be like many small rural towns with "not much left."
Storm Lake↗ET (57.8% Hispanic) was the notable exception, gaining 22 Hispanic students. The reasons for Storm Lake's resilience are not clear from enrollment data alone.
Statewide, 146 districts lost Hispanic students, 151 gained them, and 32 were flat. The loss was not uniform. It was concentrated in the largest Hispanic-serving districts.
Three forces pulling in the same direction
The most likely driver is reduced immigration into Iowa. Iowa State University sociologist David Peters told Iowa Public Radio that international immigration into Iowa dropped by approximately half in 2025 compared to 2024, following federal enforcement changes. ICE arrested more than 1,200 people in Iowa between January and October 2025. More than 200 Haitian workers lost jobs at the JBS facility in Ottumwa in November 2025.
"More than 90% of Iowa's population growth between 2020 and 2025 came from international immigration." -- David Peters, Iowa State University, Iowa Public Radio, Feb 2026
Des Moines Public Schools, where more than 25% of students are English language learners, has acknowledged the connection. DMPS officials told Axios Des Moines that while the district cannot track departures by immigration status, staff report a correlation between enforcement activity and family withdrawals.
A second contributing factor is Iowa's Education Savings Account program. The ESA program grew to 41,044 participants in 2025-26, up from 27,866 the prior year, costing $314 million. Public school enrollment fell by 1.53%. The Iowa Department of Education noted that projections developed before the ESA program already showed a downward trend, but the program's expansion coincides with the acceleration. Whether ESA disproportionately drew Hispanic families is unknown; the program does not publish demographic breakdowns.
A third factor operates on a longer timeline. Iowa's birth rate is 1.7 births per woman, below the replacement rate of 2.1. Hispanic births as a share of Iowa's total rose from 10.0% (2018-2020 average) to 11.2% (2021-2023 average), according to March of Dimes data. But a rising share of a shrinking total still means fewer children entering schools.
The share paradox
Hispanic enrollment fell in absolute terms, but its share of total enrollment actually rose, from 13.6% to 13.8%. This is because total enrollment dropped even faster. The denominator shrank more than the numerator.
This creates a measurement paradox: a district superintendent reading share data would see Hispanic representation growing. A superintendent reading headcount data would see it shrinking. Both are technically correct. The headcount tells the more operationally useful story, because staffing, bilingual program capacity, and Title III funding all follow the absolute number of students, not the percentage.
What the data cannot resolve
The enrollment data cannot distinguish between families who left the state, families who withdrew children to avoid enforcement risk, families who moved to private schools through the ESA program, and families whose children aged out of the K-12 system. Knudtson's explanation of Postville's loss illustrates the problem: what looks in the aggregate like an enforcement story turns out, in at least one town, to be a graduating-class-size artifact. A decline of 197 students across a population of 68,000 is within the range that any one of these mechanisms could explain on its own.
The 2021 comparison is instructive but imperfect. That year's dip of 45 students during COVID immediately reversed. Whether 2026 follows the same pattern or marks the beginning of a plateau depends on whether the driving force is temporary (a single-year enforcement shock) or structural (reduced immigration flows plus declining birth rates). The enrollment data recorded in October 2026 will be the first real test.
The rural stakes
If Hispanic enrollment does not recover, the consequences fall hardest on Iowa's smallest communities. Peters estimated that without immigration, rural Iowa would have lost 10% to 12% of its population in the last decade instead of 2%. Ben Murrey of the Common Sense Institute Iowa calculated that halting foreign immigration for four years would cost the state 11,000 labor force participants and $300 million in gross domestic product.
For school districts, the math is more immediate. Iowa provides roughly $8,000 per student in state funding. Each of the 197 lost Hispanic students represents that amount in district revenue. But the geographic concentration means Des Moines absorbs the equivalent of $2.5 million in lost funding from Hispanic enrollment alone, while Marshalltown, Denison, and Postville each lose funding on populations they cannot afford to lose.
The question facing Iowa's meatpacking corridor is whether the 2026 dip is a one-year pause in a decade-long growth trend, or the first year of a new pattern. Postville added 226 Hispanic students between 2015 and 2025. It lost 29 in a single year. The difference between those two trajectories reshapes whether these schools can sustain the bilingual programs, translated materials, and cultural infrastructure they built for a population that, until 2025-26, was always growing.
Detailed code that reproduces the analysis and figures in this article is available exclusively to EdTribune subscribers.
Discussion
Sign in to join the discussion.
Loading comments...